November’s market behaviour was constructive, as was our investments. We are also pleased that our portfolio remains ahead of our FTSE 100 benchmark, by a fairly respectable 5.7%1.
This information is taken from The Big Picture, to download a sample copy please just click here.
1 Period measured, December 31st 2014 – December 4th 2015. ISACO 1.3%, FTSE 100 -4.4%. ISACO investment performance verified by Independent Executives Ltd.
Is the market healthy or unhealthy?
The way we use to check if the market is behaving as it should is to look at the trading action (price and volume activity) of institutional investors. Why do we do this? The stock market is about six month forward looking and its daily activity is the consensus conclusion whether institutional investors like or don’t like what they see happening down the road. By watching what the big players are doing (buying or selling) each and every day, it can provide essential clues to which way the market is likely to head.
It’s best to try to get ‘in sync’
Institutional investors control approximately 75% of the market’s future direction, which is why we aim to keep ‘in sync’ with them. If you don’t, it feels like trying to swim against a strong current. When you don’t get in sync, you often get hurt financially and that’s why we like to see if the 800-pound gorilla investors are buying, because when they do, it strengthens the market.
However, if they are selling, it weakens it. The other thing we like to keep a close eye on is the behaviour of leading stocks. If the markets best stocks are acting weaker than the general averages, it’s negative. However when leading stocks are outperforming the market, it’s positive.
Bull market? Bear market? Where are we?
Take a look at this 20-year chart of the NASDAQ Composite and you’ll see that the bull market that began in March 2009 (Point A) is still in play.
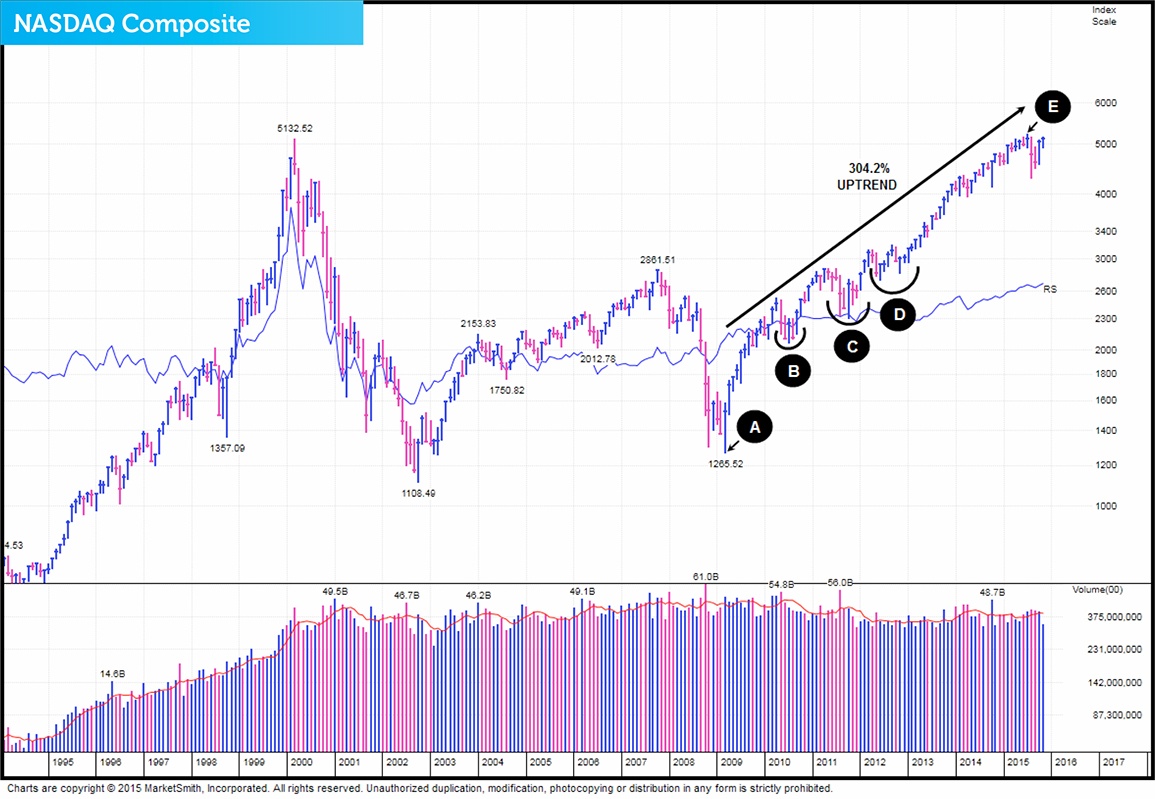
Since the uptrend began, the NASDAQ Composite has made a very impressive return of 304.2%2. However, to make that gain it has had to experience four quite challenging corrections. The first (Point B) occurred from April to November 2010. The second (Point C) is a correction that started in May 2011 and ended in January 2012. This second one was quite harsh and resembled a ‘mild’ bear market’. The third (Point D), began in late March 2012 and finished March 2013. The final one is occurring right now and resembles the 2011 retracement. This one therefore also has the hallmarks of a ‘mild’ bear market and it began July this year (Point E). The good news for investors is that it currently looks like it may end fairly soon.
2 Performance data taken November 26th 2015. ISACO investment performance verified by Independent Executives Ltd.
NASDAQ setting up for breakout?
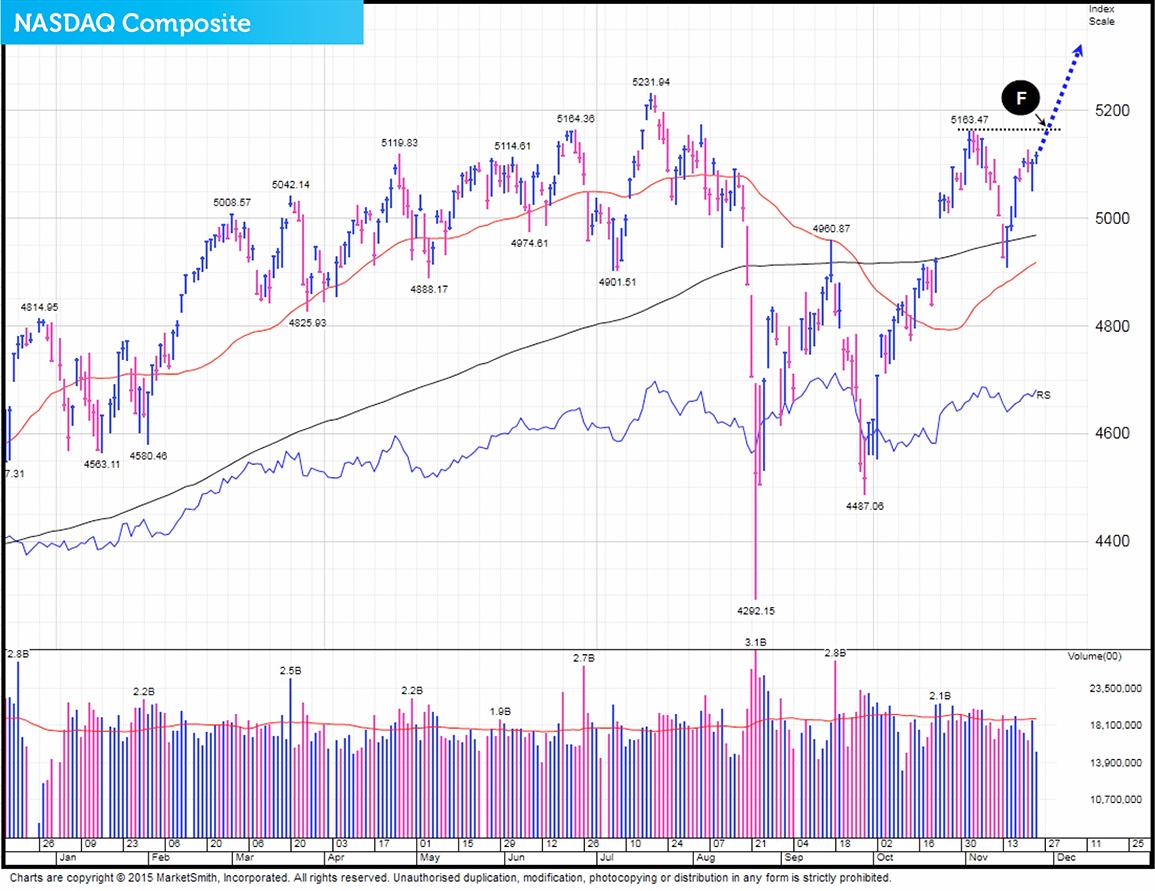
When we looked at the market on Thursday November 26th, the NASDAQ appeared to be setting up for a breakout. On that day we pointed out in our Daily Market Update….
“Even though it appears on the surface that there may be a reluctance to buy from institutional investors, we still believe that the Composite is most probably setting up for a breakout attempt. The pivot point price level that it needs to punch above is 5163 (Point F)."
First breakout attempt fails
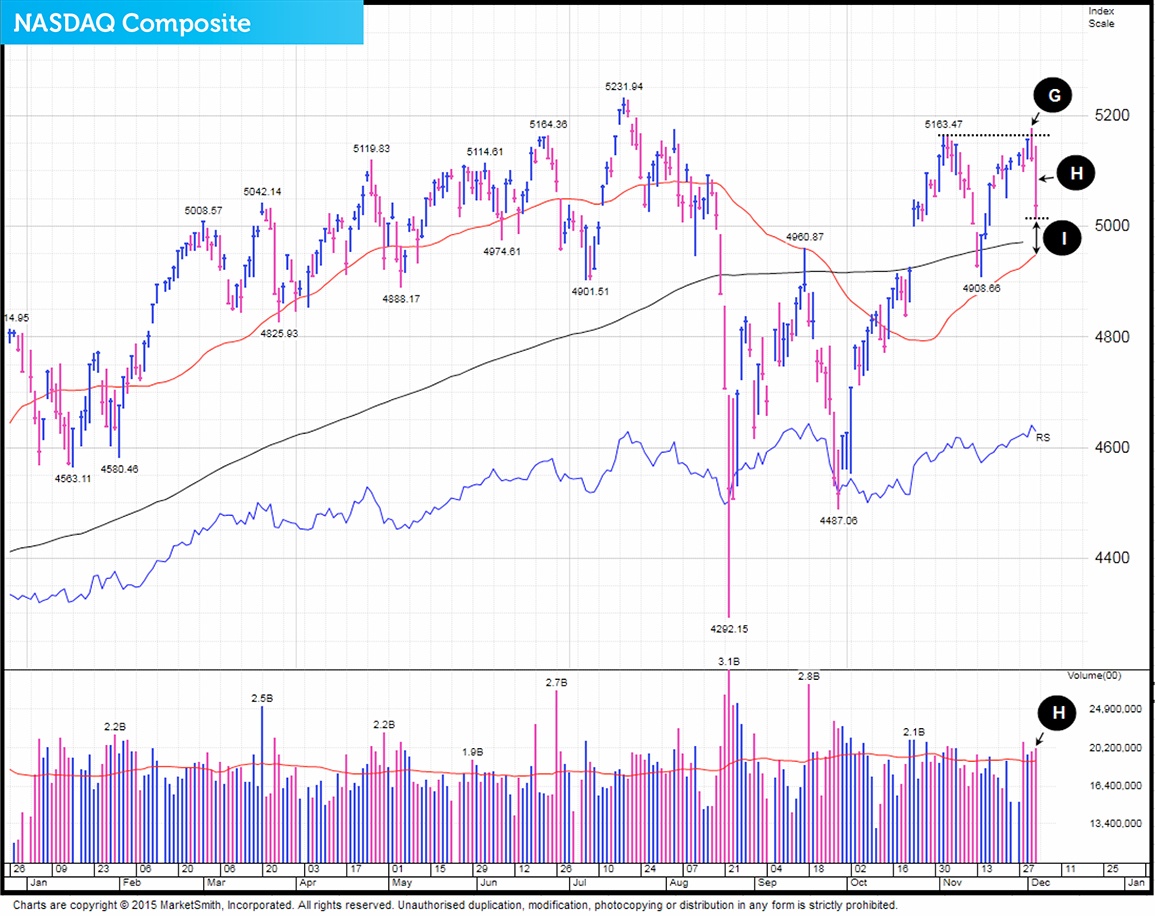
On Friday December 4th, we wrote in our Daily Market Update….
‘Just two days ago, Wednesday December 2nd, the NASDAQ attempted to breakout (Point G) but unfortunately it was unsuccessful. With the Composite plunging yesterday 1.67% in fast trade (Point H) it means that the NASDAQ has now had three days of institutional selling over the last four sessions. There is no doubt about it that this recent bout of heavy distribution will have weakened the market, making it prone to further falls especially with it ending on Thursday close to its intra-day low. However on the plus side from where it’s currently trading down to its 50-day moving average, there is a thick wall of solid support (Point I). Therefore, even though the markets recent behaviour will have spooked many investors, we are still of the opinion that all is well and that the Composite’s first attempt to breakout was more likely to have been just a little premature.’
When looking at the market on the following day, Friday December 4th, the NASDAQ Composite shot up 2.08% (Point J). Trading volume unfortunately came in below average (Point K), which was slightly disappointing because it suggested a possible reluctance to buy from the big players.
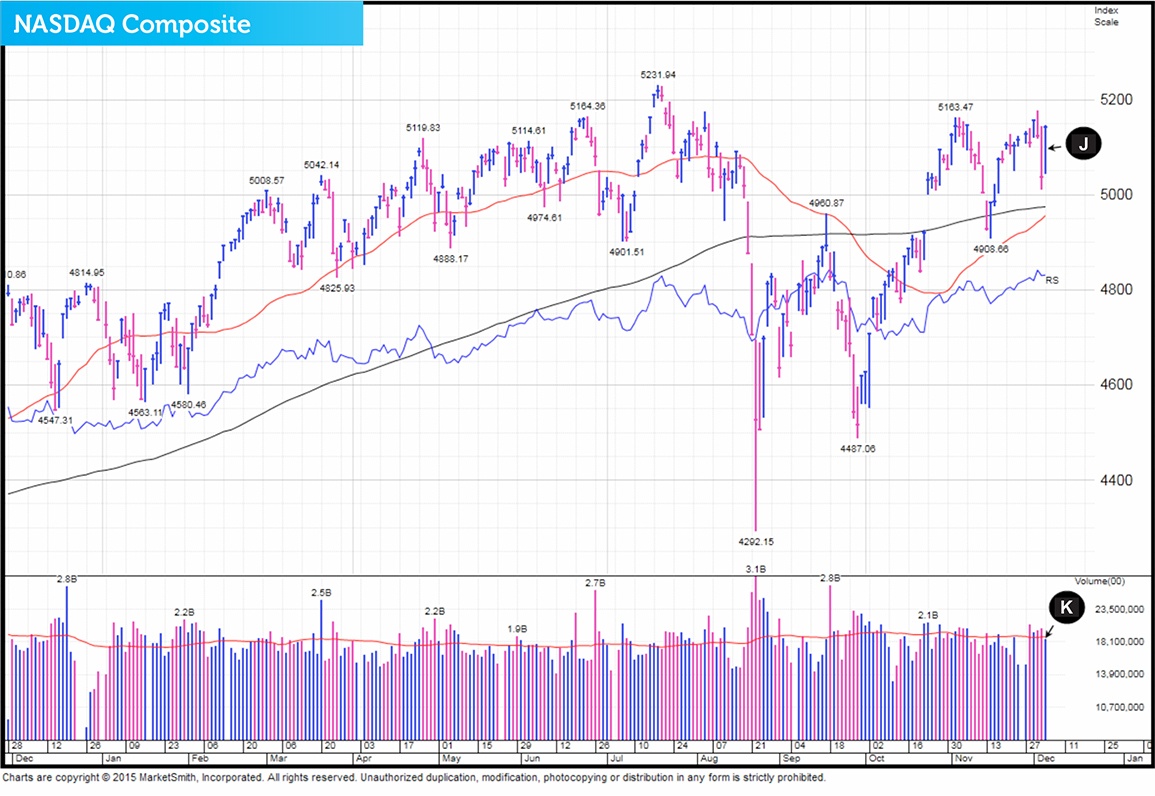
After dropping 1.67% on Thursday December 3rd (Point L) it was good to see the NASDAQ powering up 2.08% Friday December 4th and erasing those losses. From here we would like the Composite to stage another breakout attempt to get back above its resistance at the 5163 level (Point M).
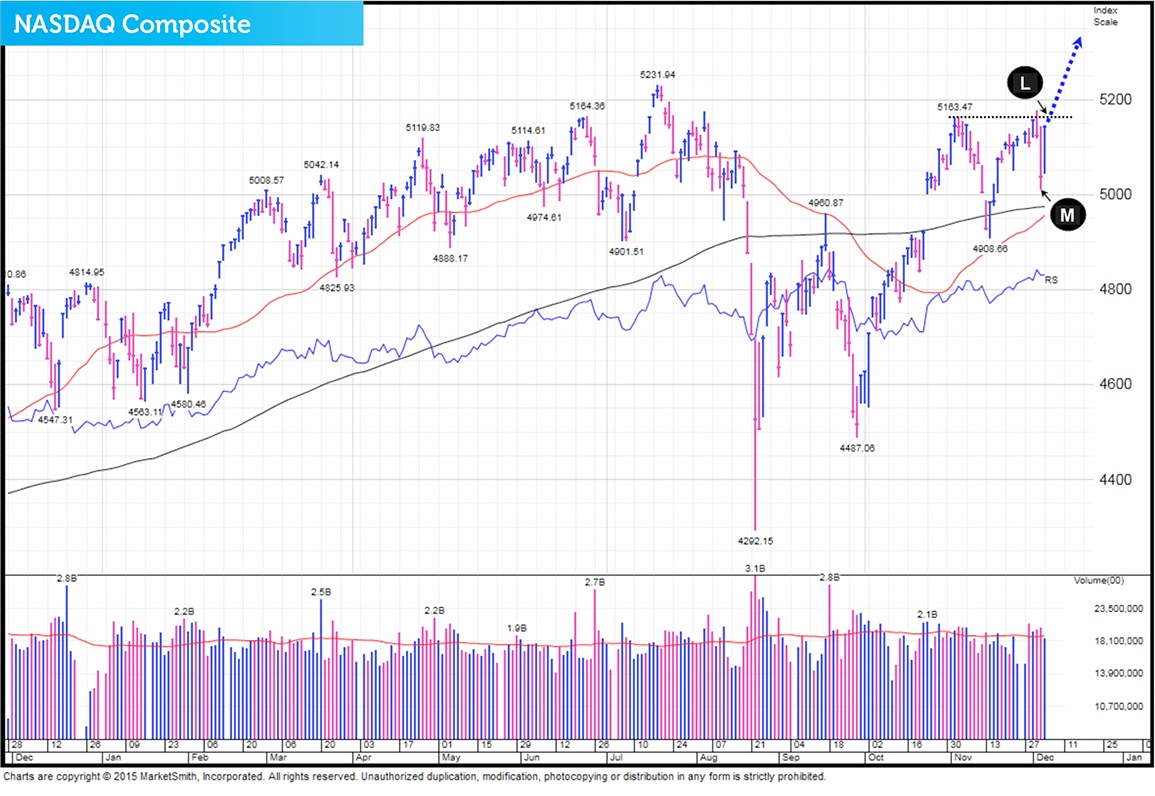
Although the Composite did end the day on Friday December 4th, with a decent gain, it came in sub par volume which has prompted us for now to remain neutral with our short term outlook.
This information is taken from The Big Picture, to download a sample copy please just click here.
As always, if you have any questions or thoughts on the points covered in this post, please leave a comment below or connect with us @ISACO_ on Twitter.
As we grow our wealth, you grow yours. Together we prosper.
ISACO are a specialist in ISA and SIPP investment and together with our clients have an estimated £75 million actively invested3. To help investors like you, we offer a high end service called ‘Shadow Investment’. Put simply, we invest and you invest beside us. As we grow our wealth, you grow yours.
How does Shadow Investment work?
Shadow Investment allows you to look over our shoulder and buy the same investments that we are buying. It’s an intensely personal service which gives you the opportunity to piggyback on our expertise and makes investing easier, simpler and much more enjoyable.
Delivering superior performance
We have an active investment strategy which aims to control risk and deliver superior performance. Over the last 17 years4, we’ve beaten the FTSE 100 by 77.9% and over the last 3 years5, we’ve made an average annual return of 9.5% versus the FTSE 100’s 5.7%.
Get in touch
If you have over £250,000 actively invested, click here to arrange a free financial review (valued at £495) with Paul Sutherland, ISACO’s Managing Director.
3 Internal estimation taken January 1st 2015 of total ISA and pension assets owned by the ISACO Investment Team and ISACO premium clients.4 December 31st 1997 - December 31st 2014 ISACO 105.5%, FTSE 100 27.6%.
5 December 31st 2011 – December 31st 2014.
ISACO investment performance verified by Independent Executives Ltd.


