The good news is that markets appear to have bottomed out – recently experiencing ‘multiple’ follow throughs – an indicator we use to help confirm a change of trend from down to up.
This information is taken from The Big Picture, to download a sample copy please just click here.
Is the market healthy or unhealthy?
The way we use to check if the market is behaving as it should is to look at the trading action (price and volume activity) of institutional investors. Why do we do this? The stock market is about six month forward looking and its daily activity is the consensus conclusion whether institutional investors like or don’t like what they see happening down the road. By watching what the big players are doing (buying or selling) each and every day, it can provide essential clues to which way the market is likely to head.
It’s best to try to get ‘in sync’
Institutional investors control approximately 75% of the market’s future direction, which is why we aim to keep ‘in sync’ with them. If you don’t, it feels like trying to swim against a strong current. When you don’t get in sync, you often get hurt financially and that’s why we like to see if the 800-pound gorilla investors are buying, because when they do, it strengthens the market. However, if they are selling, it weakens it. The other thing we like to keep a close eye on is the behaviour of leading stocks. If the markets best stocks are acting weaker than the general averages, it’s negative. However when leading stocks are outperforming the market, it’s positive.
Bull market? Bear market? Where are we?
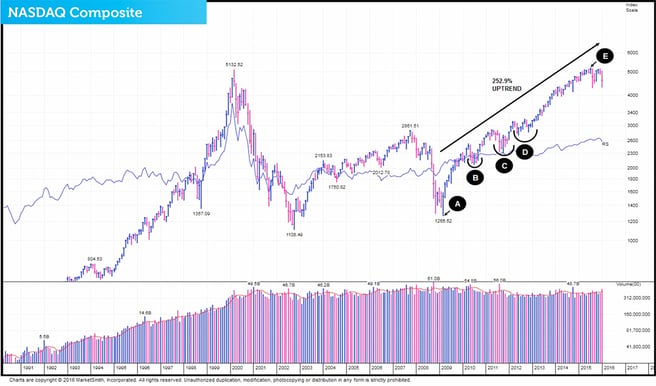
Take a look at this 20-year chart of the NASDAQ Composite and you’ll see that the bull market that began in March 2009 (Point A) is still in play.
Since the uptrend began, the NASDAQ Composite has made a very impressive return of 252.9%1. However, to make that gain it has had to experience four quite challenging corrections. The first (Point B) occurred from April to November 2010. The second (Point C) is a correction that started in May 2011 and ended in January 2012. This second one was quite harsh and resembled a ‘mild’ bear market’. The third (Point D), began in late March 2012 and finished March 2013. The final one is occurring right now and resembles the 2011 retracement. This one therefore also has the hallmarks of a ‘mild’ bear market and it began last July (Point E). The good news for equity investors is that this present one looks like it’s just found a bottom which would mean that it’s now on its way back up.
1 Performance data taken January 28th 2016.
Markets appear to have bottomed
In our Daily Market Update on Thursday January 28th, we pointed out quite a few key points.
The first was the behaviour of the markets leading stocks. We said:
‘For the second time this week, a bullish divergence occurred resulting in seven leaders rising and only five falling. On a day that the NASDAQ fell over 2%, you’d normally see thirty or even more of the markets best equities falling in fast trade.’
We also said…
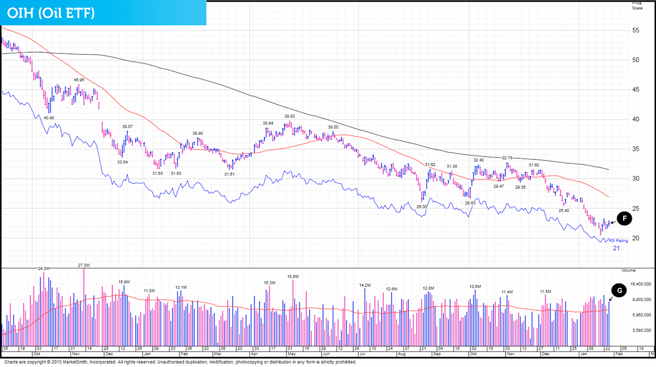
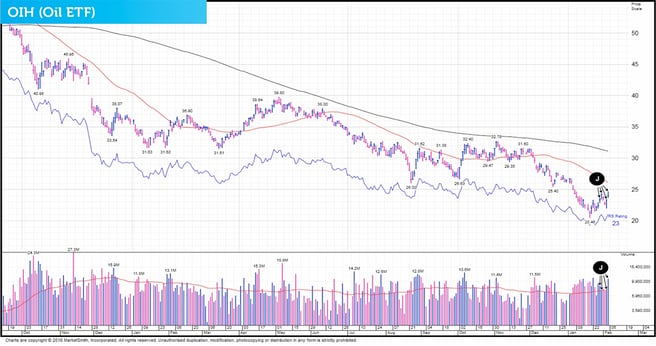
‘Wednesday’s behaviour was far from perfect – especially with the indexes dropping in heavy volume – and at a quick glance of purely the price action, it would be easy to get spooked. However when you dig deep and look at what really happened, you discover some real information gems. The first was the bullish divergence with leading stocks. The second was another bullish divergence which in this case occurred in the oil market. The OIH (Oil sector ETF) gained 0.9% (Point F) for the day and it happened in heavy trade (Point G). This could mean that the Oil sector has also finally found a bottom, another positive.’
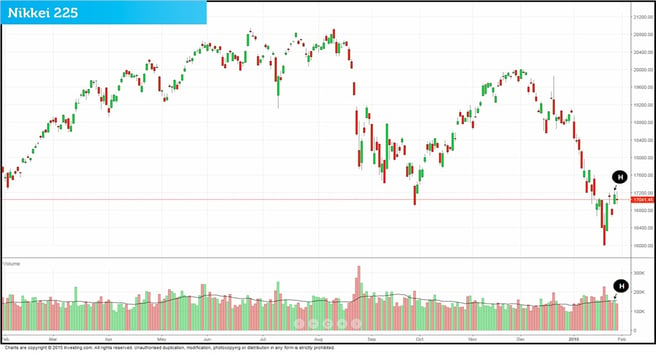
We also pointed out that the Dow had followed through on Tuesday January 26 and that the Nikkei 225 had followed through Wednesday Jan 27.(Point H).
We said...
‘With the Nikkei confirming its latest rally attempt, it should be a positive for the Japanese fund that we hold.’
Other salient points were also mentioned such as…
‘We’ve also recently reported that the S&P 600 has followed through twice (last Friday and this Tuesday) which is a double confirmation. What’s more, the biotech sector followed through last Friday (positive for our biotech fund) and even though its behaviour since the follow through has been a bit spotty, because the 269 low it made January 20th has so far not been breached, it means its new attempted rally is also still intact.’
We closed our daily update with the following comments:
‘The financial media also remain extremely bearish and highly sceptical of this latest rally attempt (which is also good) and so far we’ve not heard anybody in the financial world mention the word ‘follow through’, another plus. The key thing to understand with this last point is that we don’t want the financial media saying that the market has bottomed. If they were, it would probably kill the rally. Therefore, when you take all these points into account, it tells us that right now is most probably a perfect environment for the market to rise.’
Further ‘follow through’ confirmations
When looking at the markets on Friday February 5th, in our Daily Market Update we said:
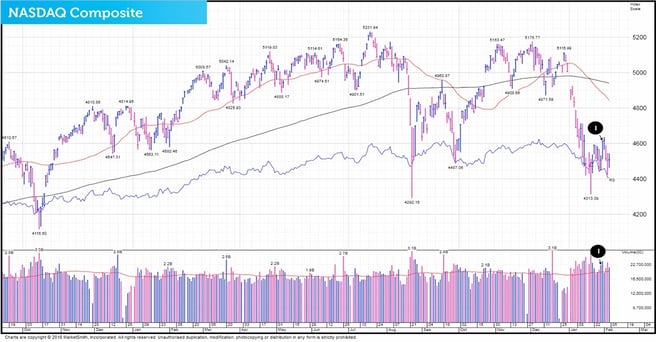
'Recently we’ve seen multiple ‘positive’ events occurring. On Friday January 29, the NASDAQ had a powerful ‘day 7’ follow through (Point I).’
We continued with…
‘The S&P 600 has had three follow throughs (January 22, 26 and 29). The S&P 500 has also followed through January 29. The Dow Jones has had two confirmed follow through’s, the first on January 26 and the second January 29. The S&P 400 (US mid cap index) has also recently experienced two follow through’s, occurring January 26 and January 29.’
In the update, we also pointed out another key observation, this time about oil:
‘The oil sector is also something we’ve been watching closely and its recent sliding price has not helped global investor sentiment. It is therefore good to report that the OIH (oil sector ETF) has recently experienced four follow throughs, occurring January 28, 29 and February 3 and 4. (Point J). We believe the recovery in the oil market will greatly boost and restore investor confidence and help to push this market slowly back to the highs it made in July 2015.’
We also mentioned the Nikkei 225’s positive behaviour. We said:
‘Finally if we move to Asia, the Nikkei 225 had its second follow through confirmation, this time on day 6 which occurred Friday January 29, surging 2.8% in explosive volume (2.94b versus 3 month average of 1.45b), a 102% increase.’
‘Taking all these things into consideration, we are of the belief that the market has bottomed and it’s now on its way back up. This latest rally is clearly broad and has legs. However from here it’s not going to go back up in a straight line. Instead we’ll continue to see and experience extreme volatility and that means from time to time the market will have some big down days. However our take is that when we start to look at things on a week by week basis, we are confident that as we progress forward in time, we’ll start seeing the market and our investments trending higher. What we have just gone through is perfectly normal even though it’s not been nice to experience. A ‘significant’ correction in the markets was well overdue and the good news is that this recent retracement has helped the markets to ‘reset’. That means from here we believe there will be some good money to be made especially over the next two to three years.
From a positioning point of view, it’s way too early to say what the leaders of the next uptrend will be because the current rally is only two weeks old. However when it’s been running for about a month, we’ll have a much better idea of which stocks and sectors are likely to lead. After three months, there will be even more certainty of which ’horses’ to put our money on. The main thing right now is to remain calm, exercise patience and watch the market to see where the big money is flowing.’
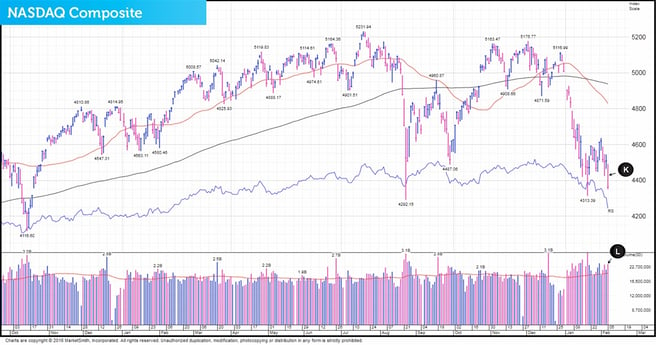
On Friday February 5 the index and stock action was neutral. The NASDAQ Composite fell 3.25% (Point K) in above average volume (Point L). This type of behaviour normally suggests that institutional investors were selling stock.
Leading stocks action was positive. Even though a larger percentage of quality equities fell in heavy trade compared to those which advanced in heavy trade, nine leaders made gains and only seventeen fell. This is very unusual ‘bullish’ activity. It also suggests that the majority of Fridays selling was more likely to have come from the uneducated, uninformed investors.
Friday’s action did take us by surprise especially with the NASDAQ selling off hard and closing at a level which has now effectively killed its latest rally attempt. However there are still far more positives than negatives. For example, leading stocks acted well despite the intense sell off. The S&P 400, 500 and 600’s rallies are still in play despite the brutal selling. The Dow, the Nikkei 225 and the oil sectors rallies are also still intact.
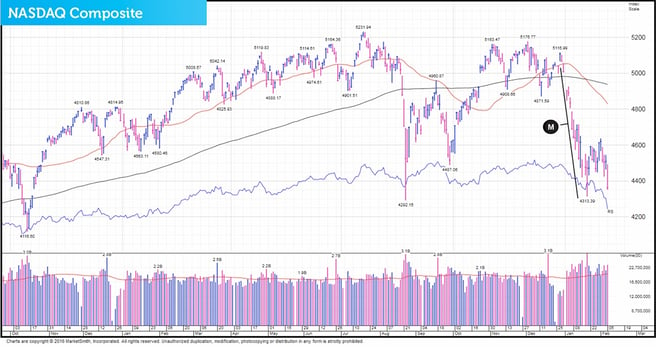
The reason we believe why we have seen the NASDAQ roll over is most probably because of the 15.7% drop it experienced in the 3 week period between December 29 and January 20 (Point M). When an index, stock, fund or sector experiences such falls in a very short period of time, it is literally impossible for it to rebound in a straight line. Retesting lows is therefore normal and natural. Often the ‘old low’ is breached which could happen in the NASDAQ’s case.
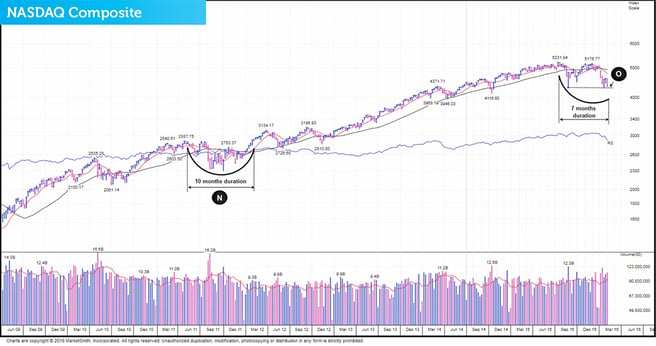
However let’s remind ourselves that this correction is very similar to the 2011 ‘severe bull market’ correction that lasted ten months (Point N) This retracement is so far seven months old which means we are likely to remain in correction territory possibly until Spring or even Summer 2016. It’s a fact that the NASDAQ does has a lot of support at its current levels (Point O) and therefore we’d be very surprised if it didn’t rally soon from this point.
This information is taken from The Big Picture, to download a sample copy please just click here.
As always, if you have any questions or thoughts on the points covered in this post, please leave a comment below or connect with us @ISACO_ on Twitter.
As we grow our wealth, you grow yours. Together we prosper.
ISACO are a specialist in ISA and SIPP investment and together with our clients have an estimated £75 million actively invested2. To help investors like you, we offer a high end service called ‘Shadow Investment’. Put simply, we invest and you invest beside us. As we grow our wealth, you grow yours.
How does Shadow Investment work?
Shadow Investment allows you to look over our shoulder and buy the same investments that we are buying. It’s an intensely personal service which gives you the opportunity to piggyback on our expertise and makes investing easier, simpler and much more enjoyable.
Delivering superior performance
We have an active investment strategy which aims to control risk and deliver superior performance. Over the last 18 years3, we’ve beaten the FTSE 100 by 99.7% and over the last 3 years4, we’ve made an average annual return of 9.8% versus the FTSE 100’s 1.9%.
Get in touch
If you have over £250,000 actively invested, click here to arrange a free financial review (valued at £495) with Paul Sutherland, ISACO’s Managing Director.
2 Internal estimation taken January 1st 2015 of total ISA and pension assets owned by the ISACO Investment Team and ISACO premium clients.
3 December 31st 1997 - December 31st 2015 ISACO 121.0%, FTSE 100 21.3%.
4 December 31st 2012 – December 31st 2015.
To download our free report 'A Golden Opportunity' >>
To download our Shadow Investment brochure >>

