The FTSE 100, our benchmark, has annualised 6.2% since its inception 34 years ago1. That tells us that if we can beat the FTSE 100 over the long term, we’re going to be blessed with a reasonable rate of return.
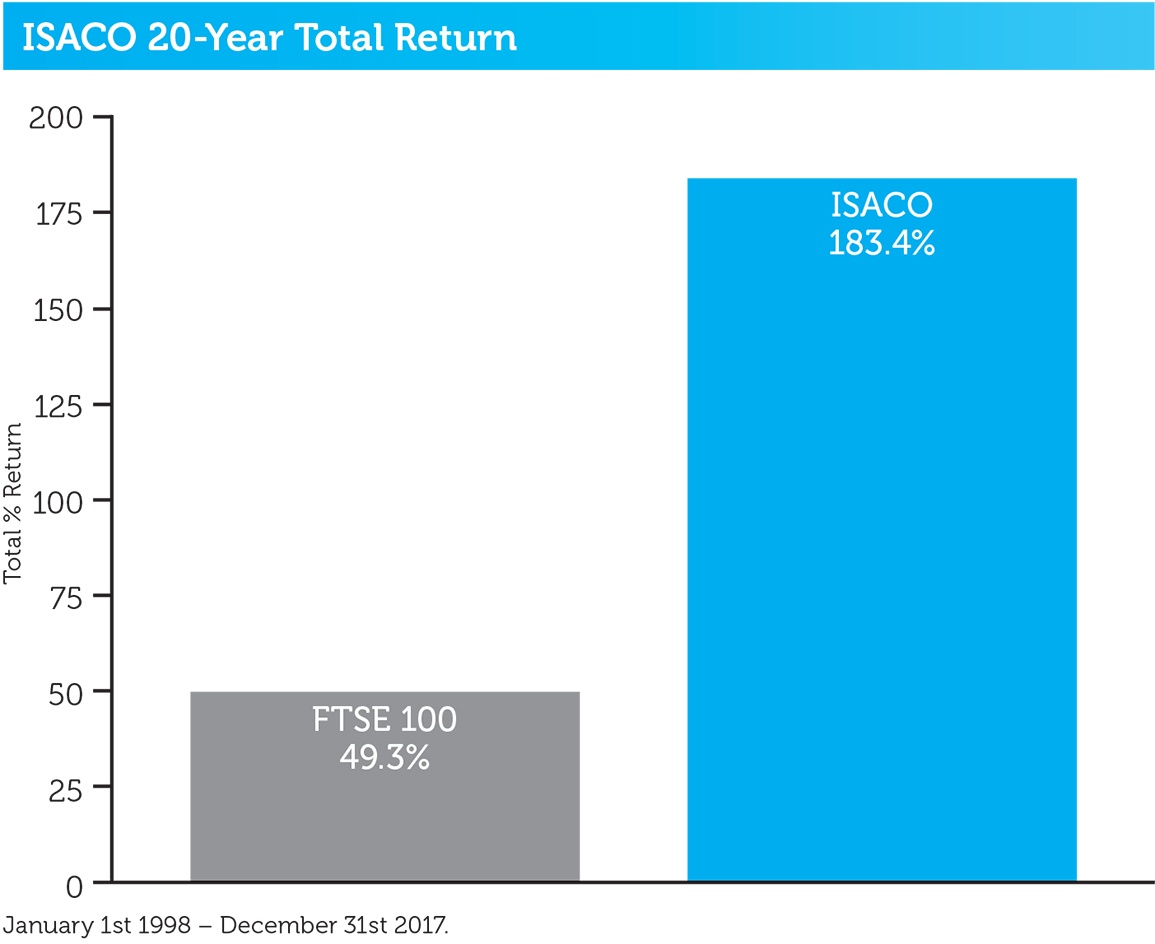
Since beginning investing back in 19972, to the close of 2017, when comparing the total return, we outperformed the FTSE 100 by 134.1% which means over that 20-year period we’ve beaten the main UK stock index on average by 3.3% per year. Past performance is no guarantee of future performance.
1 January 3rd 1984 – December 31st 2017.
2 January 1st 1998 – December 31st 2017.
After seeing our 20-year performance record, you may now be thinking…
- How did they do it?
- What is their secret?
- How can I apply their strategy to my own portfolio?
Let me start by sharing with you a little bit about the way we invest.
We have an active investment strategy which aims to control risk and deliver superior performance. The investment process involves identifying the world’s best fund managers and combining them effectively to achieve diversification and reduce our exposure to risk. Whenever we change our view on a fund we’ve selected, or identify a better opportunity, we take swift, decisive action.
Our secret
This is no secret but we do have some very important things that we do that massively contributes to our long-term track record of outperformance.
One such thing is to watch the market each and every day and correctly interpret its behavior. By doing this, you can then aim to make better investment decisions.
Religiously reading the market and deciphering what the activity means is vital because there are always four questions you need to ask each and every day:
- Should I be invested right now?
- If yes, should I be fully invested or partially invested?
- If I should be invested, what should I be invested in?
- Should I be staying in those investments or making an adjustment?
Right now, is the market healthy or unhealthy?
It’s best to try to get ‘in sync’
Institutional investors control approximately 75% of the market’s future direction, which is why we aim to keep ‘in sync’ with them. If you don’t, it feels like trying to swim against a strong current. When you don’t get in sync, you often get hurt financially and that’s why we like to see if the 800-pound gorilla investors are buying, because when they do, it strengthens the market. However, if they are selling, it weakens it.
The trend is your friend
Therefore, even if you have a real knack for picking the best fund, if you are wrong about the trend of the market, your portfolio is going to suffer. This happened to thousands of uninformed investors in the great bear markets of 2000–2002 and 2007–2009. Many investors mistakenly think that it is all about choosing the best investments to park their money in. While finding quality investments is important, it’s not as crucial as getting in sync with the market’s trend and direction. This means it’s essential that you have a reliable method of determining which way the market is heading.
With all this in mind, would you like to know what our current market analysis is telling us?
Good because in our March 2018 edition of The Big Picture we said…
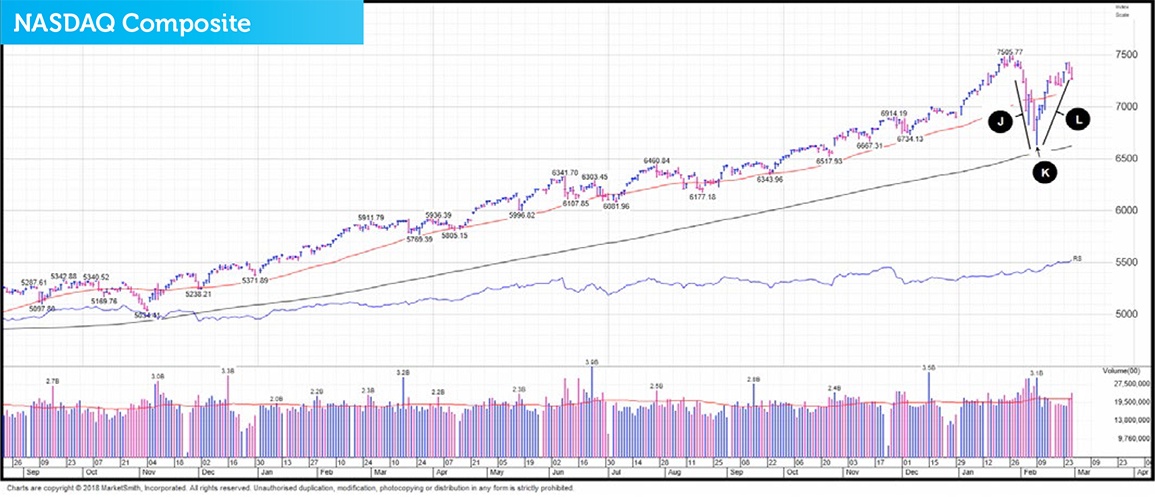
‘The market is acting exactly as we expected it to. For a while now we’ve been highlighting our concern with the recent ‘change’ of character and that the recovery rally had been looking far too 'V' shaped, meaning it was more prone to failure. The big alteration in the overall market dynamic occurred February 2nd to February 9th 2018. This was the period when the NASDAQ Composite lost an abnormal 10.2% in just six trading days (Point J). What’s more, volatility seriously spiked up which we’d not seen in a very long time. After hitting a bottom February 9th 2018 (Point K), the NASDAQ then proceeded to rally an impressive 12.2% in just twelve trading days (Point L).
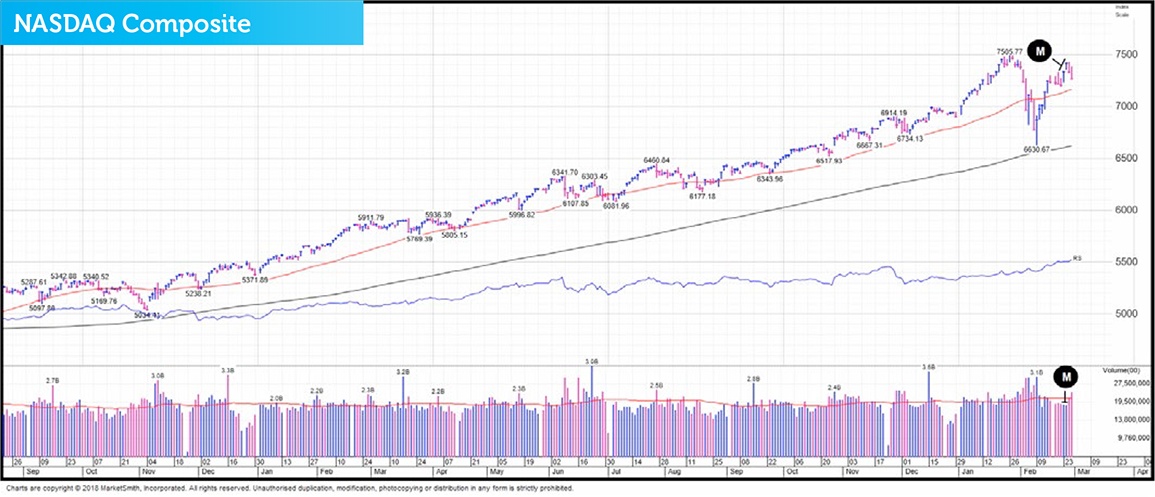
Recently the financial media became very bullish due to what they touted as a powerful market rebound and by doing so most probably will have lured back in lots of rookie investors. From a contrarian point of view, bullishness from the financial media is rarely good. This could be the reason that over the last four days, we’ve started to see cracks appearing in this latest rally attempt which tells us that the snapback has possibly run out of steam. The first clues were the recent two days of gains made in very tame trade (Point M).
And more obvious clues came in the last two days of heavy institutional selling (Point N).
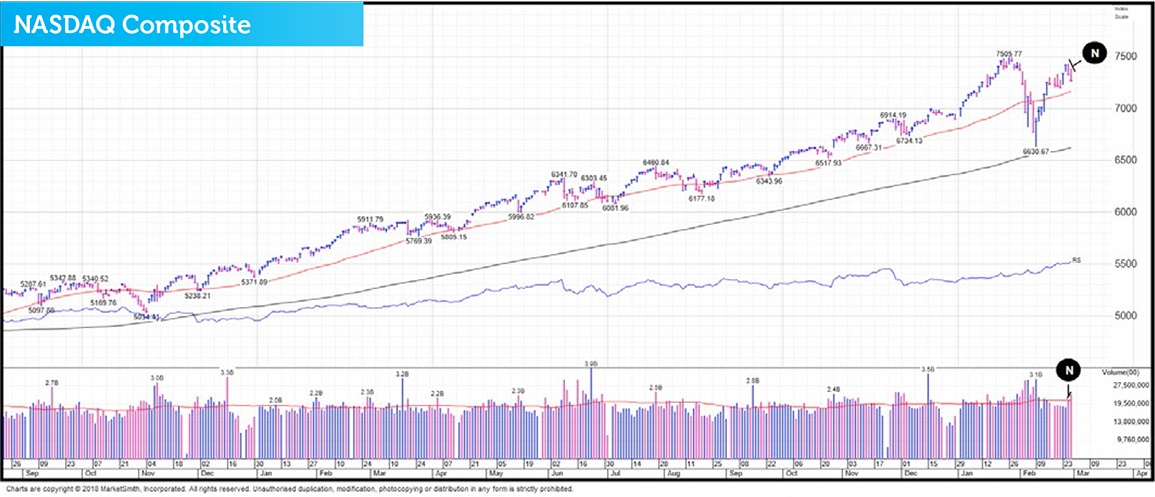
If we are right with our thinking, the market is most probably going to head lower. In times like this when we have to exert patience and think long-term, it’s always good to remember that corrections of this nature are absolutely essential in helping the market to rest and reset ready for its next leg higher.
It’s also worth mentioning that recently de-risking our portfolio by raising cash has helped us continue to outperform our FTSE 100 benchmark. We are currently beating it this year by a respectable 4.4%. That’s really good performance especially when you take into consideration that the NASDAQ Composite has recently rallied 12.2% and throughout that up move we have been only 47.4% invested in equities.’
-----------------------------------------------------------------------------------------------------------------------------------------------------------------
Some of the information contained in this blog has been taken from The Big Picture, to download a sample copy please just click here.
As always, if you have any questions or thoughts on the points covered in this post, please leave a comment below or connect with us @ISACO_ on Twitter.
A specialist in ISA and SIPP Investment
ISACO are a specialist in ISA and SIPP investment and together with our clients have an estimated £75 million actively invested1. Our flagship service is called ‘Shadow Investment.’ ‘Shadow Investment’ is a unique service which gives you the opportunity to look over our shoulder and buy the same actively managed funds that we personally own, effectively piggybacking on our expertise.
Put our money where our mouth is
The key difference with our service is that we put our money where our mouth is. And as an ISACO premium client, you’ll have the opportunity to mirror our ‘market–beating2’ investment portfolio throughout the year. This gives you the potential for achieving almost identical returns to the ones we make. Past performance is not a guide to future performance.
Shadow Investment benefits:
- Low cost (typically 1% per year)
- Saves you time
- Offers the potential for superior ‘tax-free’ growth (8% annual aims).
The Shadow Investment Service has been created to save you the hassle of having to become an investment expert and allows you to keep full control of your investment account. It takes the hard work out of investing and helps to remove the uncertainty of knowing what investment funds to buy, when to buy, if to hold and when to sell.
Get in touch
If you have over £250,000 actively invested, click here to arrange a free financial review (valued at £495) with Paul Sutherland, ISACO’s Managing Director.
1 Internal estimation taken January 1st 2015 of total ISA and pension assets owned by the ISACO Investment Team and ISACO premium clients.
2 January 1st 1998 - December 31st 2017 ISACO 183.4%, FTSE 100 49.3%.


