For 2012, my expectations and outlook remain the same as they were at the beginning of the year. I expect my benchmark the Nasdaq Composite to make a gain in excess of 18.3% and my aim is to outperform the Nasdaq.
The year has started with a bang. The Nasdaq Composite has returned extremely impressive year to date gains of 11.5%. The FTSE 100 is up a respectable 5.9%, and my account is up 10.6%.
As you are well aware, past performance is no indication or guarantee of future results, and the value of any investment you make can go down as well as up.
Gains of this nature are positive but cannot be sustained. A huge move like the one we've just had in such a short space of time tells me that the bull market that started in 2009 is probably ready for its next leg upwards.
However monthly gains of this magnitude cannot continue throughout the year and that means sooner or later the market will have to take a breather. The market's correction that began in February last year looks like it could soon to be over. Even though 2011 was a hellish year for most investors, believe it or not what the market has just experienced is a 'healthy' bull market correction and not a more serious 'unhealthy' bear market correction like many people would have you believe.
Bull markets generally last two to four years in length and sometimes they last for more than four years. During every bull market there will be correction periods and these correction periods are less severe than their bear market counterparts. My philosophy is, stay fully invested during bull markets and only exit when you believe the market's trend and behaviour has changed. When this happens, it means a new bear market has begun and that's the time to move into cash.
My take is and has been for some time now that the market over the next decade will outperform. There are numerous facts and statistics that point to the likelihood of outperformance and the behaviour of the market over the last three years gives me even more reasons to believe a stock market boom has probably already begun and that it started in March 2009.
To help you see and understand what the stock market has done over the last twenty years, take a look at this chart. As you can see, the market has made no price progress since October 1999.
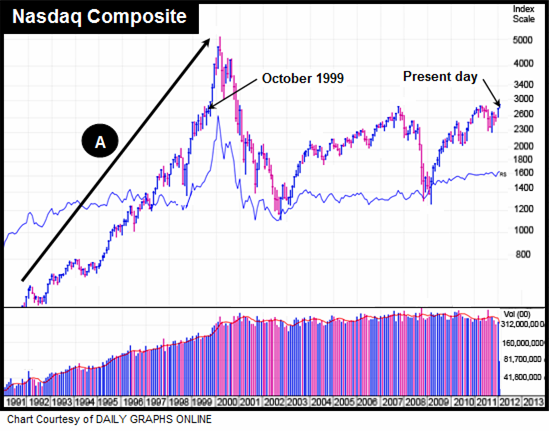
Look also at what happened from 1990 to 2000 (Point A). Notice it was a period when the market was surging. Notice how strong the uptrend was and the huge price gains that were made. Over this 'boom' period the Nasdaq made an average yearly gain of 24.5%. Returning 24.5% per year over a ten year period cannot continue indefinitely and that's the reason why the market needed time to rest and recover over the last twelve years.
Since the 1800's when the stock market began, after prolonged periods of sideways movement it has always 'eventually' moved into new high ground. After huge runs, the market often has extended periods of zero price movement. This should be viewed as normal.
The cycle works as follows: after a period of rest, the market starts it's next move northwards and this is the time to be invested. It's good to know there will always be periods of outperformance and underperformance. The rule is, after a period of underperformance, you'll probably see a period of outperformance. And after a period of outperformance, you'll probably see a period of underperformance. Because we've had to sit though 12 years of underperformance, the next decade could be one of outperformance and that means now is probably a perfect time to be invested in equities for the long-term.
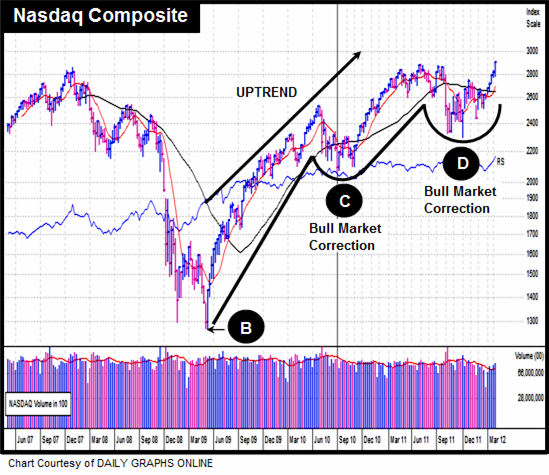
This chart is a weekly view of the Nasdaq Composite and covers five years of activity. I wanted you to see this chart to demonstrate it is still in an uptrend that began March 2009 (Point B). Since the bull market began, the Nasdaq Composite has experienced two extremely challenging corrections. The first (Point C) occurred April to November 2010. The second (Point D), is a correction that looks as if it's finally over.
The 2010 correction was 18.7% in depth and seven months in length. The more recent one was 20.4% in depth and eleven months in length.
Corrections of this type are not particular nice periods for an investor who is long on the market. During these periods faith, patience and courage are essential in helping you to weather the storm. Eventually corrections end but having to sit through them, especially when they have all the hallmarks of the most recent one is challenging and can be extremely stressful.
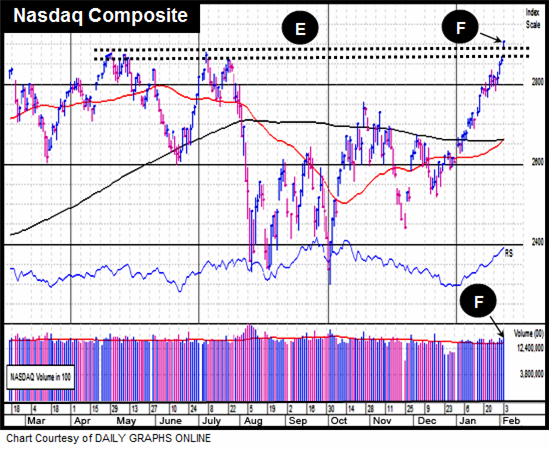
Next take look at a daily view of the Nasdaq. This chart shows the price and volume activity that has taken place over the last twelve months. The Nasdaq has recently broke through some tough resistance between 2862 and 2888 (Point E). On Friday 3rd Feb, it bullishly gapped up and broke through (Point F) in heavy trading volume. The big questions now are: Can the old resistance become support? and can it remain above 2888? If the market does pull back from these levels, ideally you'll want to see it find institutional support at 2888.
There is also another index, the Nasdaq 100 which is also worth keeping an eye on because it's currently leading the general market higher.
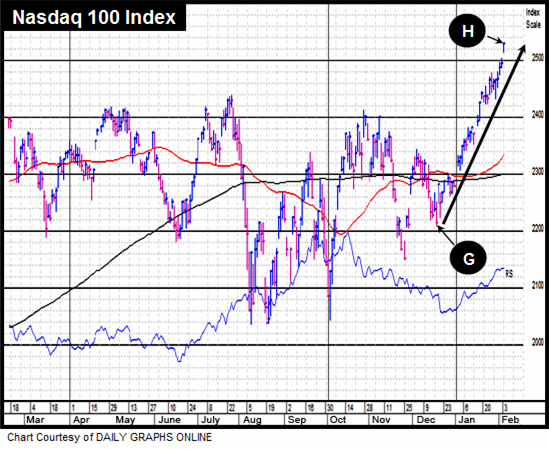
From the 19th December 2011 (Point G) to Friday 3rd February (Point H), the Nasdaq 100 has made an impressive move of 14.4%.
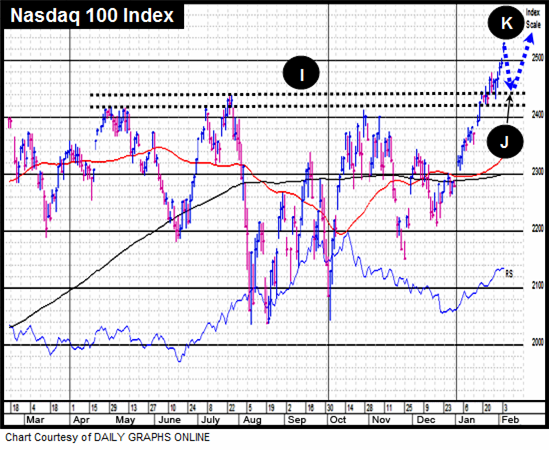
Just like its brother the Nasdaq Composite, the 100 also recently broke through a thick wall of strong resistance which occurred between 2417 and 2438 (Point I). It's currently trading 3.7% above the wall and because the market is due a pullback, my take is that it will probably be short but sharp. Pulling back to the 2438 (Point J), finding institutional support followed by heavy accumulation would be perfect text book action if it was to occur.
In my mind, this possible future scenario makes a lot of sense. The market environment is too bullish at the moment which is something I don't like because most market commentators get it wrong nearly every time. When they are bullish the market ends up dropping, and when they are bearish the market rises. That's why a swift, sharp drop back to the 2438 level could be just the thing needed to turn the environment bearish again. If it did drop and the 100 finds support, it would then be free and clear to continue its recent northerly run (Point K).
Finally let's take a look at the Nasdaq 100 but this time using a weekly chart over a five year period.
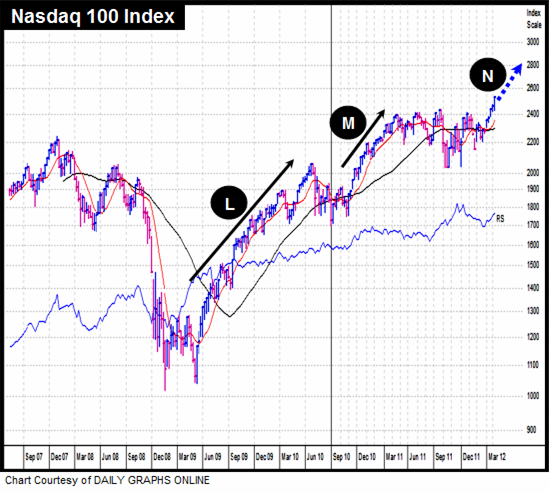
As mentioned earlier, the bull market began March 2009 and so far has experienced two long and deep bull market corrections. Bull markets start with an uptrend (point L), correct and then the uptrend continues (Point M). On this chart you can see that it's had two uptrends so far (Points L and M) and my belief is that 2012 will be uptrend number three (Point N).
About ISACO
We specialise in providing a premium Investment Guidance Service for ISA and SIPP investors with portfolios in excess of £100,000.
Our mission is to help investors achieve better performance over the long-term, better protection in falling markets and at a better price.
For more information about ISACO and our Investment Guidance Service, please read our free brochure.
1 (Nov 2008-Nov 2011)
Please remember that past performance should not be used as a guide to future performance. The value of investments can go down as well as up and you may not get back the amount you originally invest.