 Each month I write The Big Picture newsletter for our clients, where I outline my current take on the market and its likely direction, as well as the performance of the funds I currently hold in my portfolio.
In this post, we'll look at the market's September breakout and discuss whether it can be sustained. You can find out more in October’s edition of The Big Picture monthly newsletter, which is now available – you can download your complimentary copy here.
You have to be careful who you listen to these days because the majority of the financial media would have you believe that the world is about to collapse. However the recent price and volume behaviour of the market indexes and leading stocks is positive.
The recent consolidation period has finally come to a conclusion and, as we predicted, the market has recently experienced a strong breakout. For 2012, I still expect the Nasdaq Composite to achieve a gain in excess of 10 per cent and I also expect a 10 per cent gain from my portfolio.

Bull market? Bear market? Where are we?
As previously mentioned, the general financial media continue to be negative. Many media sources make out that the stock market is in a bear market cycle, however you can't argue with facts. Take a look at this five year chart of the Nasdaq Composite and you'll see that the bull market that began in March 2009 (Point A) remains intact. In fact, we are now hitting highs not seen in almost twelve years.
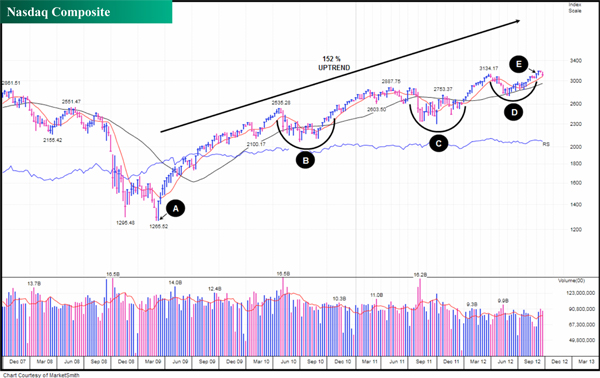
Since the uptrend began (Point A), the Nasdaq has made an impressive 152 per cent return. However, to make that gain it has had to experience three extremely challenging corrections and, as you can see, they all eventually ended. The first correction (Point B) occurred from April to November 2010 and was 18.7 per cent in depth. The second (Point C) is a correction that started in May 2011 and ended in January 2012 and was 20.4 per cent in depth. The final correction (Point D) began in late March and ended last month (Point E) and was 13 per cent in depth.
Nasdaq stages powerful breakout
Last month on 6th September we saw the Nasdaq breaking out of its cup-with-handle formation (Point F). To complete the picture, volume was above average indicating institutional buying (Point G).
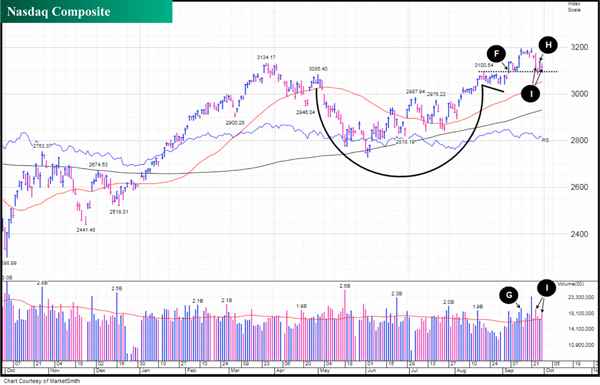
Although the Nasdaq did pullback a few days later and did drop slightly below its breakout point, the following day it did break back through (Point H). Since then however we have had a further drop on above average volume. This now gives us two days of distribution over a week period (Points I) and does raise a red flag. Due to this I will be keeping a close eye out for any more professional distribution days.
Ideally from this point going forward I would like to see the Nasdaq gathering its strength for another attempt at trying to clear its current resistance around the 3200 level. This area has been tested twice before on the 14th and 21st of September (Points J) hopefully weakening it.
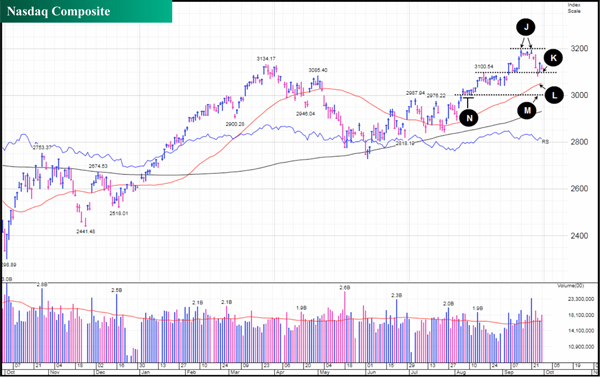
If, on the other hand, it does decide it needs a breather we may see it coming down and testing its breakout point once again (Point K). If it does pullback below its breakout point its next level of support is its 50 day moving average (Point L), a key area used by big institutions to load up on stock. Failing that the Nasdaq does have very strong support at the 3000 level (Point M) an area that was tested many times before in August 2012 (Points N).
To download your free copy of The Big Picture, please just click here.
As always, if you have any questions or thoughts on the points I've covered, please leave a comment below or connect with us @ISACO_ on Twitter.
Please note past performance should not be used as a guide to future performance, which is not guaranteed. Investing in Funds should be considered a long-term investment. The value of the investment can go down as well as up and there is no guarantee that you will get back the amount you originally invested.
Find out where an expert invests
Are you an ISA or SIPP investor with over £100,000 actively invested? Are you looking for better returns but are unsure which funds to invest in? ISACO Wealth, our personal investment service, allows you to buy the same funds as a star-performing investor. You find out where he invests, keep full control of your account, enjoy a close relationship with a trusted expert, and benefit from the potential for attractive long-term returns.
To find out where an expert invests >>


