 Each month I write The Big Picture newsletter for our clients, where I outline my current take on the market and its likely direction, as well as the performance of the funds I currently hold in my portfolio. In this post, we'll look at the market's behaviour in October and where it might head next.
You can find out more in November's edition of The Big Picture monthly newsletter, which is now available – you can download your complimentary copy here.
The importance of facts
The three strongest market months are upon us. Historically November, December and January have proved to be the best months for making money. The financial media continue to tell us that the world is about to collapse. However, as you will see, I tend to ignore the opinions of others and instead stick to the facts.
In my opinion it’s best to let the market tell you what’s going on. How? Personally I want to see if institutional investors are buying or selling. Why? The big players control approximately 75% of the market’s future direction, and so it’s best to try to get ‘in sync’ with their trading activity, or it’s going to feel like trying to swim against a strong current. You’ll also probably get hurt.
I like to see if the 800 pound gorilla investors are using key support areas to secretly load up on stock. If institutional investors are buying, that’s good, because it strengthens the market. However, if they are selling, it weakens it. The other thing I like to keep a close eye on is the action and behaviour of leading stocks.
Why? If the leaders are acting weaker than the general market, it’s negative. However when leaders are outperforming the market, it’s positive. It’s simple really. When leaders are underperforming, the market is more likely to head lower, and if leaders are outperforming, the market is likely to head higher.

Bull market? Bear market? Where are we?
Many media sources continue to suggest that the stock market is in a bear market cycle, however you can’t argue with facts. Take a look at this five year chart of the Nasdaq Composite and you’ll see that the bull market that began in March 2009 (Point A) remains intact.
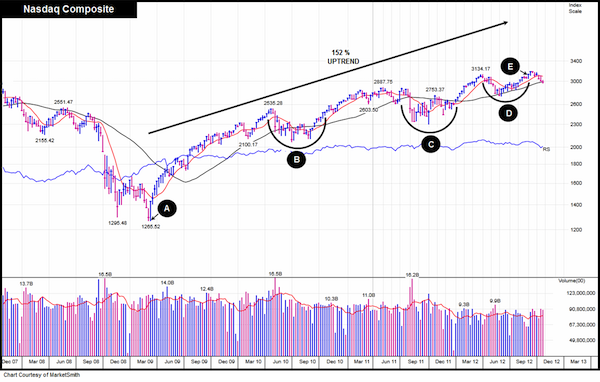
Since the uptrend began, the Nasdaq has made an impressive 152% return. However, to make that gain it has had to experience three challenging corrections. This latest correction is much milder and is currently displaying bottoming behaviour.
The first correction (Point B) occurred from April to November 2010. The second (Point C) is a correction that started in May 2011 and ended in January 2012. The third (Point D), began in late March and ended September 2012 (Point E) however just after that correction ended, the market then started to correct again.
Why another correction so soon?
My opinion is that we are going through yet another normal and natural retracement period.
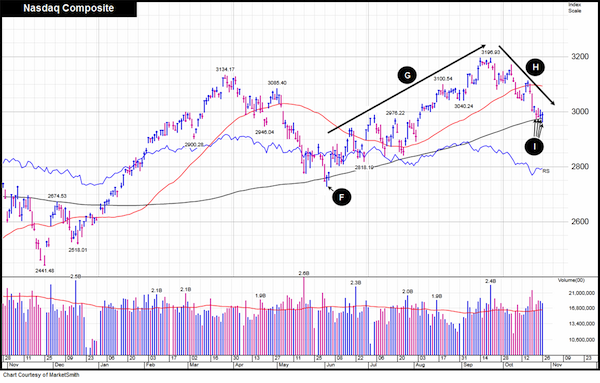
Here is a 12 month chart of the Nasdaq. As you can see, the March to September correction found a bottom on 4thJune (Point F). From its low it then proceeded to rally 17.2% over the next three months (Point G). So far this correction has been 7.4% (Point H), which to me appears to be very reasonable after making close to 20% in just twelve weeks. Markets pullback for a reason – they do it to get rid of the excess. They retrace and throw out all the investors who arrived late to the party. They shake out all the investors who are not thinking long-term. These same investors unfortunately don’t know how to read and analyse the market correctly. You see, when you look at this chart, you notice that the Nasdaq’s 200 day moving average is currently proving tremendous support. In the last four days of October (Point I), institutional investors used this key technical line to aggressively buy stock. That’s bullish and a sign that the current correction may have found a bottom.
The market was due a pullback
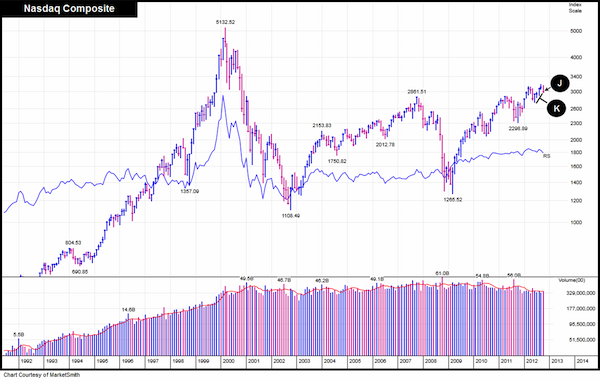
Next we’ll look at a monthly chart of the Nasdaq. As you can see, previous to this month’s pullback (Point J), the market had four straight up months (Point K) and was therefore due a rest.
Let’s remind ourselves that the market cannot keep going up in a straight line. After a run, the market needs to pause for breath. Think of a staircase where you have four steps up, one step down. When you see the market in that light, and understand that corrections are perfectly normal and natural, temporary losses in your portfolio when the market is in a correction are not as troublesome on the mind.
To download your free copy of The Big Picture, please just click here.
As always, if you have any questions or thoughts on the points I've covered in this post, please leave a comment below or connect with us @ISACO_ on Twitter.
About ISACO
ISACO Wealth is a premium investment guidance based on what we are personally doing with our own money. Because we aim high, our service offers the potential for outstanding long-term returns combined with a warm, responsive and highly personal service.
To find out where an expert invests >>
To download the ISACO Wealth brochure >>
To start your 14 day free trial of ISACO Wealth >>
To discover 'A Golden Opportunity' >>