 On 9th March we switched out of a fund in our portfolio. The fund in question was the Fidelity India Focus fund and we channeled half of the proceeds (about 14.5% of our total portfolio) into our strongest fund, Fund A and the other half into a new fund, Fund D.
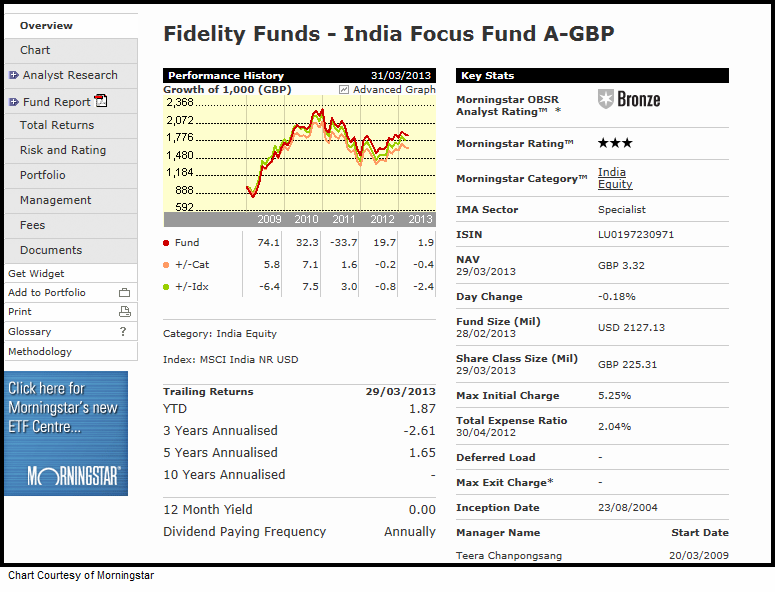
The Fidelity India Focus fund had had returned 13.1% over the last 14 months, so in this post we're going to explain why we made the switch.
This information is taken from The Big Picture, to download a sample copy please just click here.
Why we made an investment switch
We bought the India fund on 24th January 2012 at 3.12 and sold it on the 11th March 2013 at 3.53. This resulted in a 13.1% gain over 14 months. However, this fund was what we class as a laggard. Some investors are surprised when they hear this. They think, ‘13.1% over 14 months is a good gain, I’d be happy with that’. However, this fund was classed laggard because it had been underperforming the general market. We like to see the funds we own constantly ‘in the money flow’, which means when the market rallies we want to see the fund outperform both the Nasdaq Composite and the FTSE 100.
To explain further, have a look at these bullet points below:
- From 16th November 2012 to 8th March 2013 the Nasdaq made a gain of 13.9% and the FTSE 100 13.4%.
- The India fund had gained 9.8% over the same period, clearly underperforming.
- This means collectively the stocks that the India fund owned had not been ‘beating’ the market.
- At the time we made the decision to get out, the India fund year to date return was 6.17% versus the FTSE 100’s 9.2% and the Nasdaq Composites 7%.
So as you can now see, the fund was a laggard, it was underperforming and it wasn’t in the money flow. That’s why it had to go.
By contrast, next we'll look at Fund A, our current star performer, a fund we purchased in July last year.
Our star performer: A gain of 35.1% since July last year
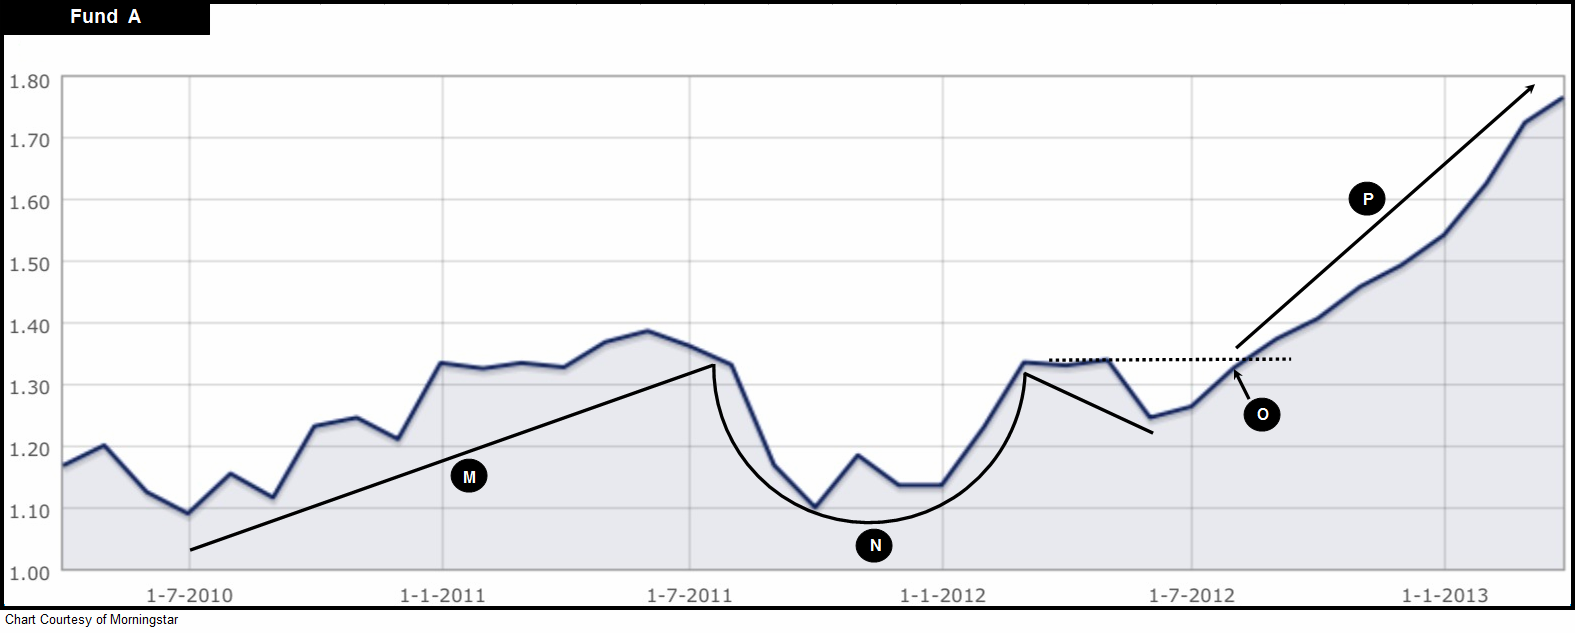
Here you can see a three year chart of Fund A and how it’s performed over the last three years. Notice that it formed a strong uptrend (Point M) and then proceeded to carve out the classic cup-with-handle formation (Point N). We purchased it on 24th July 2012 at a price of 131 (Point O), just as it was breaking out, and since then it’s gone on to make an impressive gain of 35.1%* (Point P). The Nasdaq Composite over the same period has returned 13.1%.
* Performance taken 24th July 2012 - 29th March 2013.
As always, if you have any questions or thoughts on the points covered in this post, please leave a comment below or connect with us @ISACO_ on Twitter.
About ISACO
ISACO is a specialist in ISA and SIPP Investment and the pioneer of ‘Shadow Investment’, a simple way to grow your ISA and SIPP. Together with our clients, we have £57 million actively invested in ISAs and pensions*.
Our personal investment service allows you to look over our shoulder and buy into exactly the same funds as we are buying. These are investment funds that we personally own and so you can be assured that they are good quality. We are proud to say that by ‘shadowing’ us, our clients have made an annual return of 12.5% per year over the last four years** versus the FTSE 100’s 7.4%.
We currently have close to 400 carefully selected clients. Most of them have over £100,000 actively invested and the majority are DIY investors such as business owners, self-employed professionals and corporate executives. We also have clients from the financial services sector such as IFAs, wealth managers and fund managers. ISACO Ltd is authorised and regulated by the Financial Conduct Authority (FCA). Our firm reference number is 525147.
* 15th November 2012: Internal estimation of total ISA and pension assets owned by ISACO Investment Team and ISACO premium clients.
** (31st December 2008 - 31st December 2012).
ISACO investment performance verified by Independent Executives Ltd.
To download our free report 'A Golden Opportunity' >>
To download our Shadow Investment brochure >>
To start your 14 day free 'no obligation' trial of Shadow Investment >>