 In our last post we looked at why we switched out of a fund that had returned 13.1% over the last 14 months. We channeled half of the proceeds (about 14.5% of our total portfolio) into our star performing fund and the rest into a new fund.
In this post we'll look at the performance of the other funds we own in the first financial quarter of the year.
This information is taken from The Big Picture, to download a sample copy please just click here.
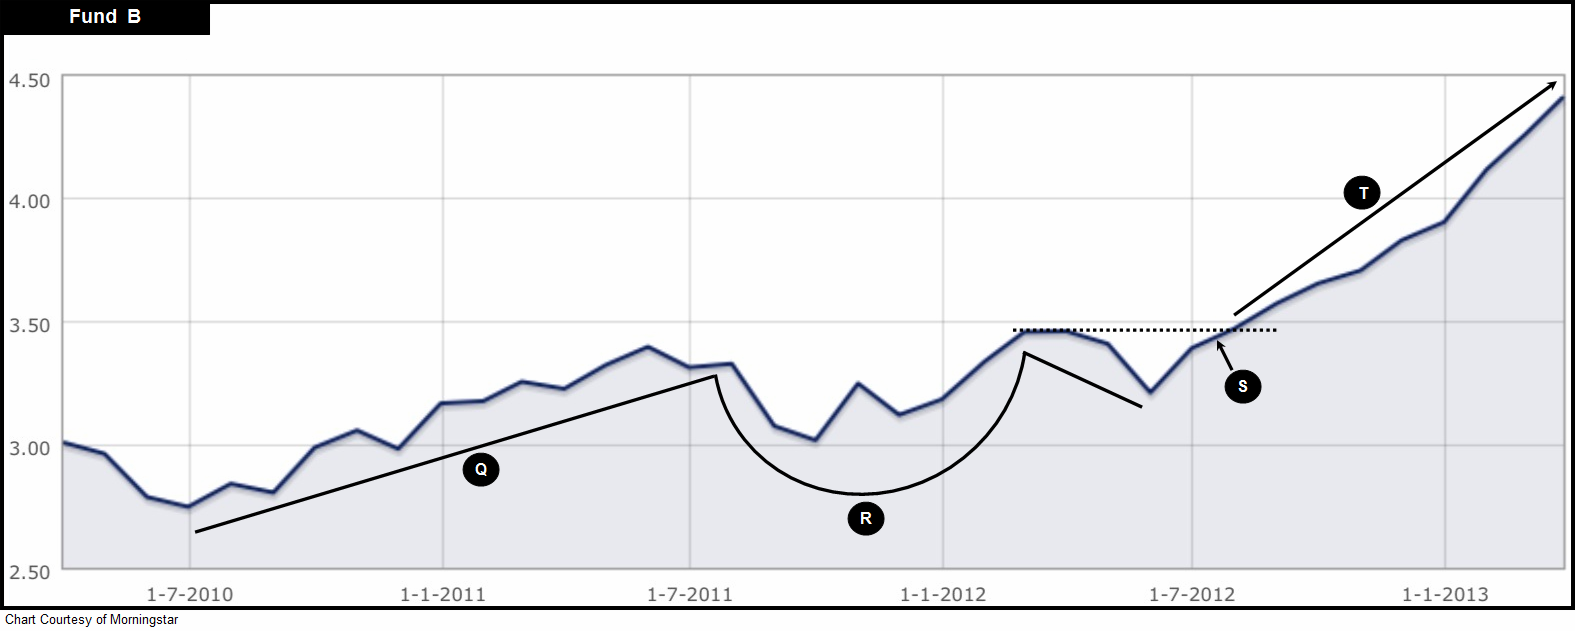
Fund B: A 29.6% gain since last July
Let’s take a look at Fund B – again on a 3 year view. Notice that it has also formed a strong uptrend (Point Q) and carved out a bullish cup-with handle formation (Point R). We purchased this one on the same day as Fund A (24th July 2012) and bought at a price of 341 (Point S), just as it was breaking out, and since then it’s gone on to make an impressive gain of 29.6% (Point T). This means that just like Fund A, it has been outperforming the Nasdaq since we purchased it.
Strong performing funds tend to get stronger
There is no guarantee that these two funds will continue to perform well. However, as we’ve been saying since we bought them, strong performing funds tend to get stronger and weak funds tend to get weaker. A 29.6% and 35.1% return on these two investments in less than 9 months demonstrates how strong the funds we choose can be and how quickly they can move once they’ve broken out and have upside momentum.
Our current laggard: Fund C
A month ago Fund C’s previous three month’s performance and its year to date returns had been impressive. This just goes to show how quickly funds can change their personality, because over the course of this month it’s become our laggard. This is a five year chart of the fund and we bought it on the 24th January 2012 at a price of 3.11 (Point U). It’s currently trading at 3.14, a measly 0.9% over the last 14 months.
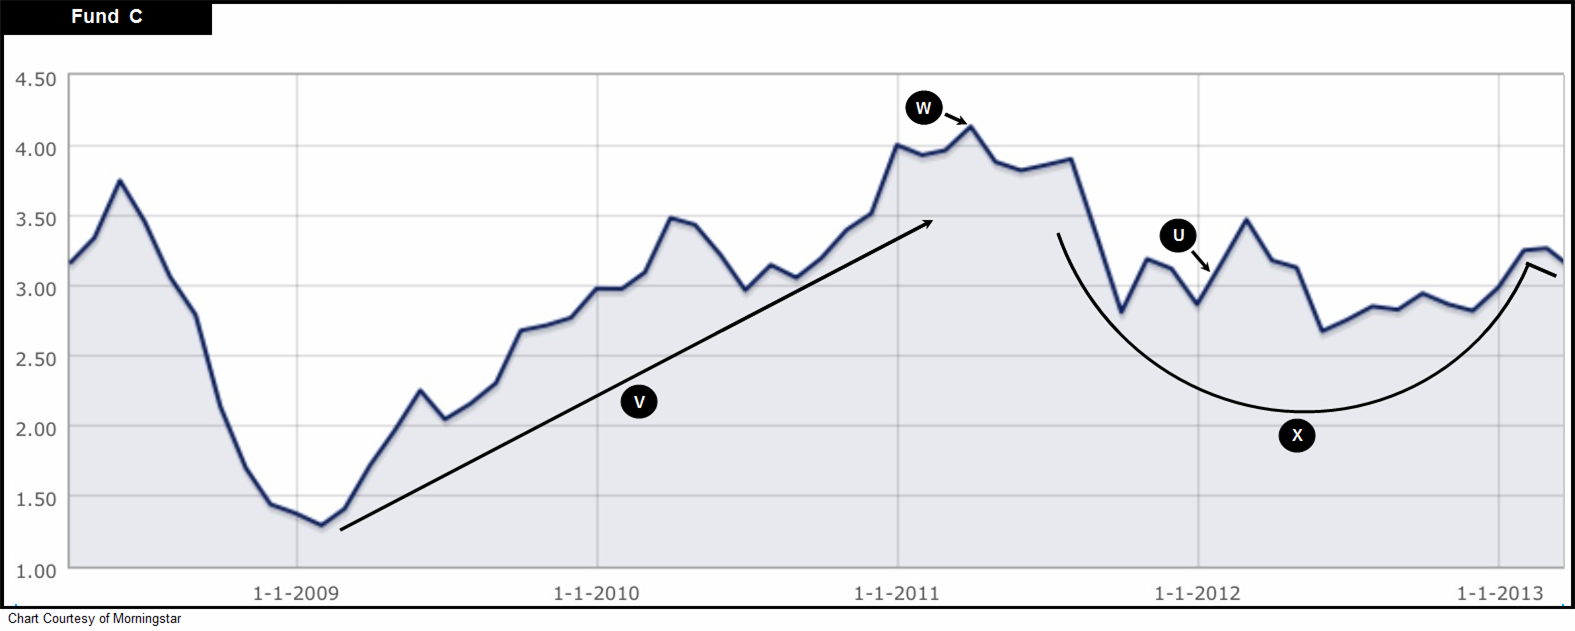
Notice how prior to us purchasing it, the fund had made a strong uptrend between 2009 and 2011 (Point V). This incredible performance (190% return over 2009 and 2010) is one of the reasons we were drawn towards it. It then topped out in early 2011 (Point W) and headed into a much needed correction. When we bought it we believed that it had hit a floor and it now looks like we were probably right. However, instead of moving higher after we got in, it has been busy building the bottom of its current base. This we believe will probably turn out to be the base of a cup-with-handle pattern (Point X). If this is true, getting in when we did will likely turn out to be a decent price point. However, our patience is wearing a little thin as we wait for it to start building its right side. We always ideally want our money working for us and, when the market is moving higher, we want to be invested in funds that are beating the indexes. So the big question is whether this fund is about to start building its right side and rocketing northwards? If the answer is ‘yes’, it would be a huge mistake to get out now. That’s why from here we want to see if it outperforms when the market starts its next leg upwards. If it does, it would give us a reason to hang on to it.
Dump or hold?
With Fund C we are currently in a situation of ‘hold’. What did impress us was the fact that on Thursday 28th March 2013 it surged 1.55%, helping it to easily outperform our other three funds for a second day in a row. This was a good sign. However, a couple of days of outperformance does not get it off the hook and it remains for now under close scrutiny. Eventually it will move northwards and build the right side of its base, probably at great speed, but the big question is when.
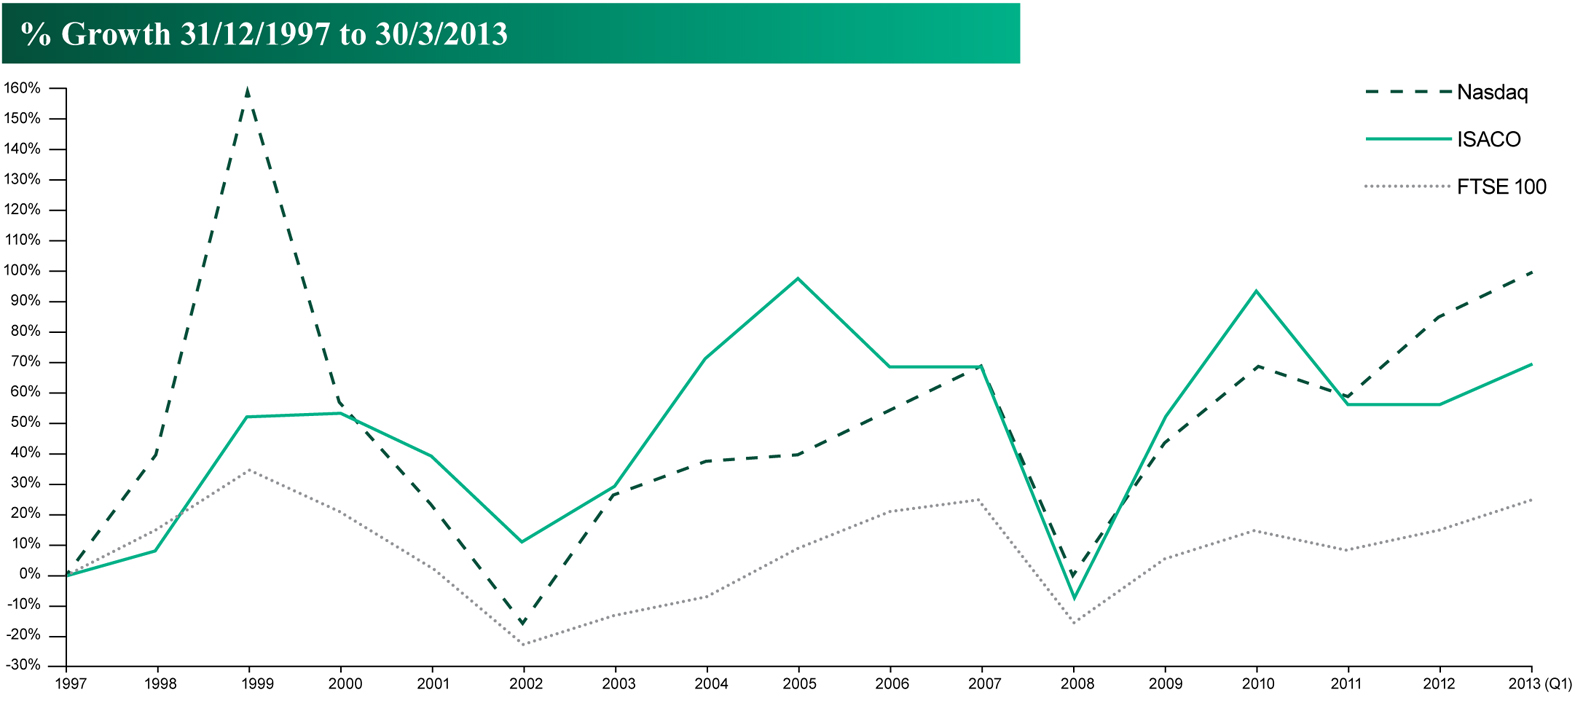
Our long-term performance
Looking over the long term, since our investing career began in 1997, we’re proud to say that we’ve outperformed the FTSE 100 by 40.8%*. This means we’ve beaten the Footsie on average each year by 2.3% over the 15 year span.
* Stephen Sutherland 55.4%, FTSE 100 14.6% (December 31st 1997-December 31st 2012).
Below is a chart that plots our long-term performance against both the Nasdaq Composite and the FTSE 100.
Our outlook: The next two years and beyond
For 2013-2014, we expect to see the FTSE 100 make a move of between 30-35% and our aim, as always, will be to beat it. In upwards trending markets, we tend to outperform the FTSE 100 by about 5%. For example, over the last 4 years**, we’ve averaged 12.5% per year versus the FTSE 100’s 7.4%. Beyond the next two years, we are expecting solid gains. This means that if you are a long-term investor like us, and you remain in the game, the future is looking bright.
As always, if you have any questions or thoughts on the points covered in this post, please leave a comment below or connect with us @ISACO_ on Twitter.
About ISACO
ISACO is a specialist in ISA and SIPP Investment and the pioneer of ‘Shadow Investment’, a simple way to grow your ISA and SIPP. Together with our clients, we have £57 million actively invested in ISAs and pensions**.
Our personal investment service allows you to look over our shoulder and buy into exactly the same funds as we are buying. These are investment funds that we personally own and so you can be assured that they are good quality. We are proud to say that by ‘shadowing’ us, our clients have made an annual return of 12.5% per year over the last four years*** versus the FTSE 100’s 7.4%.
We currently have close to 400 carefully selected clients. Most of them have over £100,000 actively invested and the majority are DIY investors such as business owners, self-employed professionals and corporate executives. We also have clients from the financial services sector such as IFAs, wealth managers and fund managers. ISACO Ltd is authorised and regulated by the Financial Conduct Authority (FCA). Our firm reference number is 525147.
** 15th November 2012: Internal estimation of total ISA and pension assets owned by ISACO Investment Team and ISACO premium clients.
*** (31st December 2008 - 31st December 2012).
ISACO investment performance verified by Independent Executives Ltd.
To download our free report 'A Golden Opportunity' >>
To download our Shadow Investment brochure >>
To start your 14 day free 'no obligation' trial of Shadow Investment >>