 One of the best ways of reading the market's health is to look at charts. A stock chart is a graph that displays the price and volume history of a given security or index over a period of days, months or years. Price and volume charts help you to see what the professional investors are doing, allowing you the opportunity to follow in the large investors footsteps.
Whether they are buying or selling, through a chart you can see what the big players are doing. Price action is how a stock or index changes in price. Volume action is the number of shares traded.
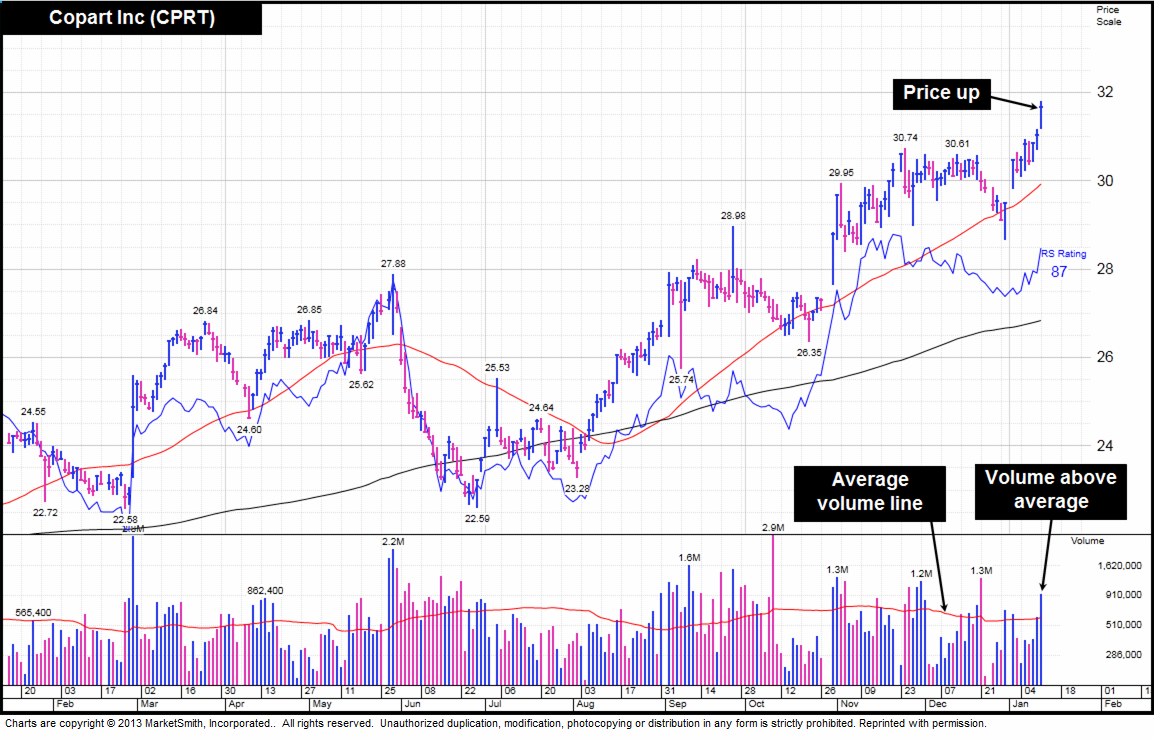
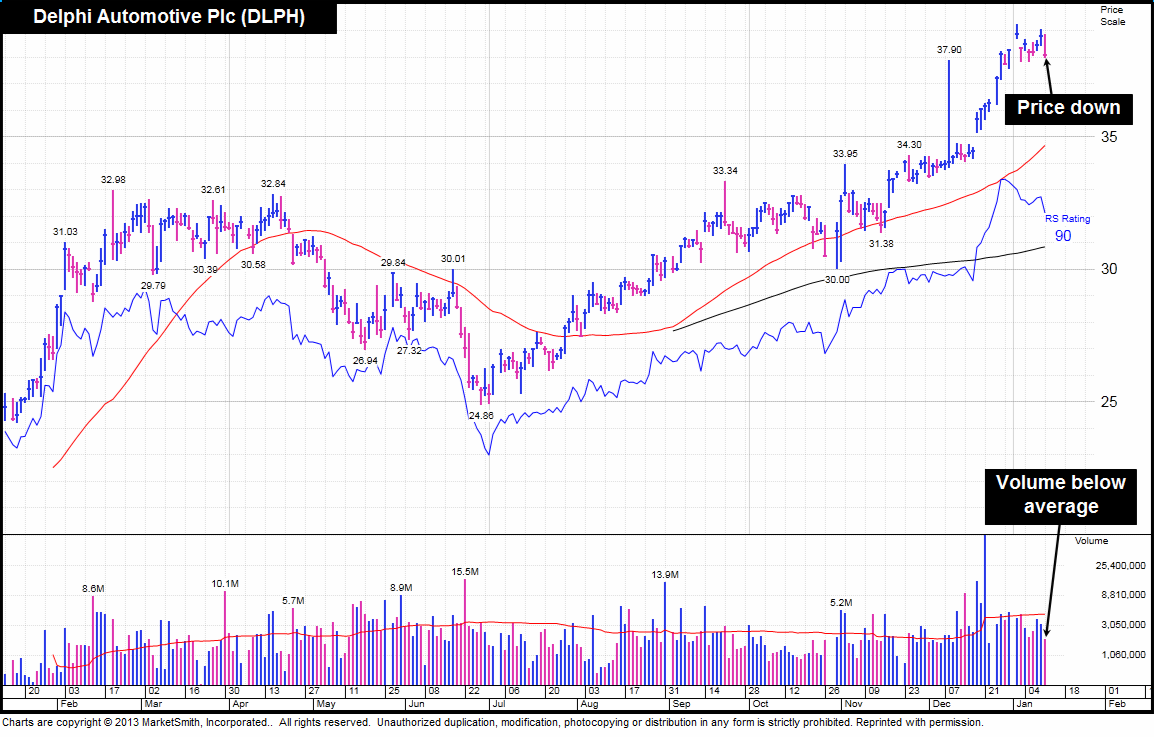
In the volume part of the chart below, notice the red horizontal moving line. That represents the average volume levels over the previous 50 days.
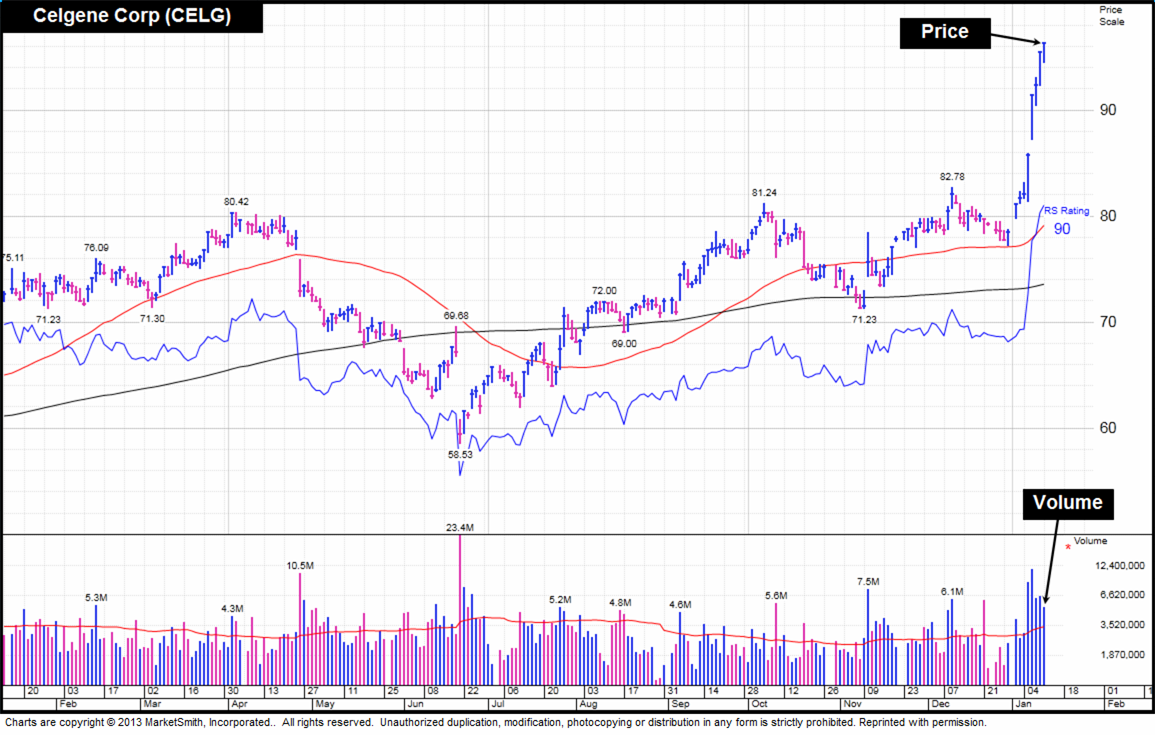
If trading volume is above average and price action is up, institutional investors are buying (you can see an example of this below). That’s good. This is classed as healthy behaviour.
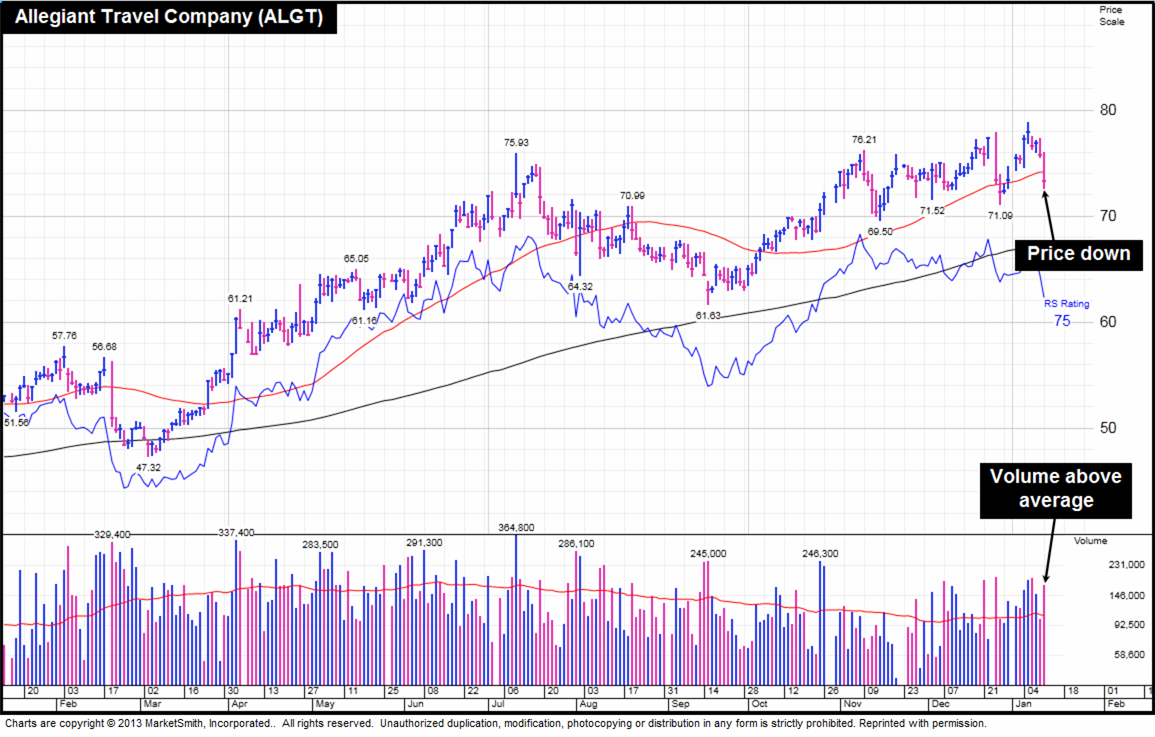
On the other hand, if volume is above average and price action is down, it means institutional investors are selling. That’s not good. This is classed as unhealthy behaviour.
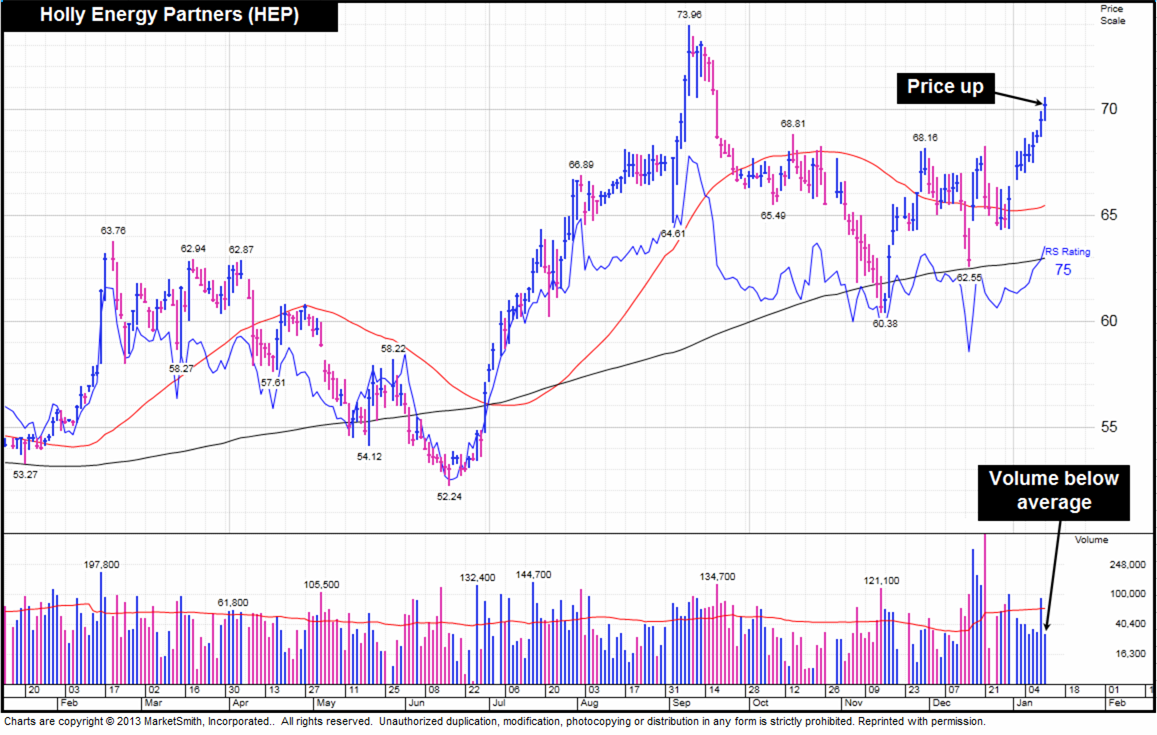
If volume is below average and the price action is up, it indicates little demand from institutional investors. That’s also not good. This is seen as unhealthy behaviour.
Finally, if volume is below average and the price action is down, it indicates that institutional investors are reluctant to sell. This type of action is good. This is seen as healthy behaviour.
It does take a lot of either buying or selling to change an established trend. By carefully analysing the markets behaviour on a daily basis, it can assist you in trying to determine if the trend has changed. If you believe it has, you can act accordingly. After analysis, if you thought the trend was up, you would invest.
However, if you believed the market’s trend was down, you could park in cash. By watching closely the trading activity, you can see exactly what institutional investors are doing with their money – effectively allowing you to get in sync, and trade with the trend, instead of against it.
As always, if you have any questions or thoughts on the points covered in this post, please leave a comment below or connect with us @ISACO_ on Twitter.
About ISACO
ISACO is a specialist in ISA and SIPP Investment and the pioneer of ‘Shadow Investment’, a simple way to grow your ISA and SIPP. Together with our clients, we have £57 million actively invested in ISAs and pensions*.
Our personal investment service allows you to look over our shoulder and buy into exactly the same funds as we are buying. These are investment funds that we personally own and so you can be assured that they are good quality. We are proud to say that by ‘shadowing’ us, our clients have made an annual return of 12.5% per year over the last four years** versus the FTSE 100’s 7.4%.
We currently have close to 400 carefully selected clients. Most of them have over £100,000 actively invested and the majority are DIY investors such as business owners, self-employed professionals and corporate executives. We also have clients from the financial services sector such as IFAs, wealth managers and fund managers. ISACO Ltd is authorised and regulated by the Financial Conduct Authority (FCA). Our firm reference number is 525147.
* 15th November 2012: Internal estimation of total ISA and pension assets owned by ISACO Investment Team and ISACO premium clients.
** (31st December 2008 - 31st December 2012).
ISACO investment performance verified by Independent Executives Ltd.
To download our free report 'A Golden Opportunity' >>
To download our Shadow Investment brochure >>
To start your 14 day free 'no obligation' trial of Shadow Investment >>