 In our last post, we explained how we have outperformed the market over the last 12 months (June 1st 2012 – June 1st 2013) with a return of 29.9%. In this post we'll give you an overview of how we did it.
If you'd like to know more, then you'll probably be interested in the 10 free one-to-one telephone sessions we're offering - they're worth £197 each, but if you are one of the 10 selected you'll get the session for free. During these sessions we'll explain our performance in much more detail.
The reason behind our outperformance
Even though we’ve made plenty of mistakes over the last twelve months, such as buying the Russia fund and the India fund way too early, we’ve still managed to beat the market and in our book that’s all that matters. The reason why we’ve accomplished this is mainly because of the decision to purchase two particular funds, which we invested in back in July 2012, Fund A and Fund B. Let’s look at them both now in more detail.
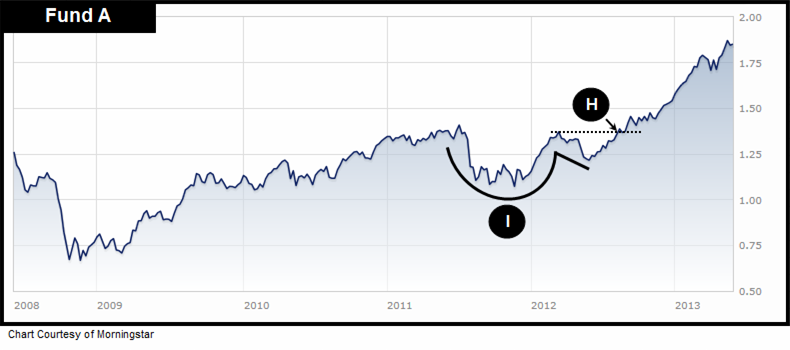
Fund A – 41.2% in 10 months
Fund A was purchased on 24th July 2012 at a price of 1.31 (Point H). Notice that we bought it after it had completed a bullish cup-with-handle formation (Point I). Also notice that just after buying it, it took off like a rocket and was trading at 1.85 on Saturday 1st June 2013, which means that so far we are sitting in a 41.2% profit.
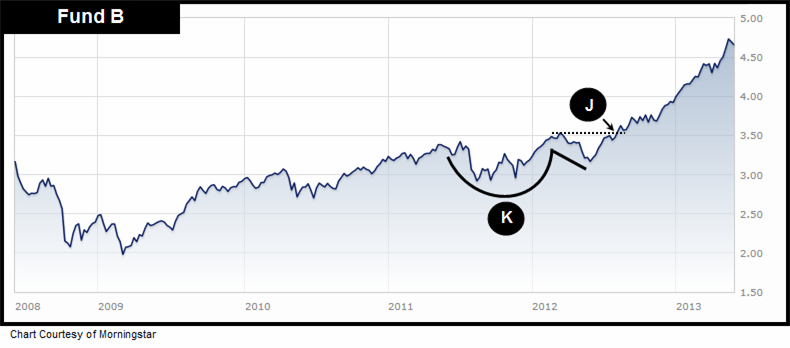
Fund B – 37.2% in 10 months
Fund B was purchased on the same day (24th July 2012) as Fund A at a price of 3.41 (Point J). Notice once again that we bought it after it had completed its cup-with-handle formation (Point K). It was trading at 4.68 on 1st June, which means that so far we are sitting in a 37.2% profit.
Analysing our three recent buys
On 12th March this year, we purchased Fund C and one month later we bought two more, Fund D and Fund E. Let’s start our analysis by looking at our March buy, Fund C.
Fund C
This fund’s performance since purchase has not been great (a gain of 0.8%). This is because of making the mistake of buying it a little late. However, recently we’ve noticed that it’s acting much better and weathering the general market correction extremely well.
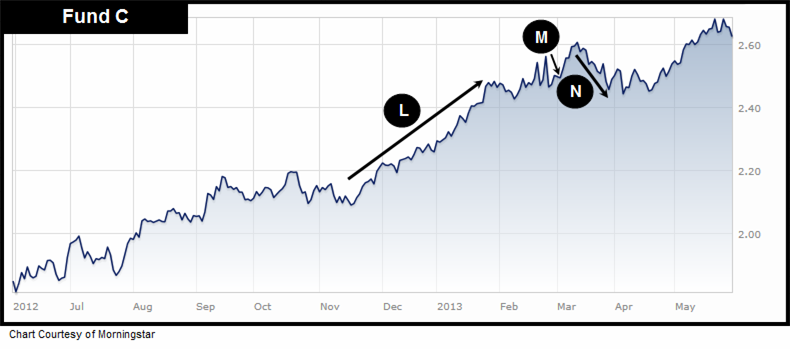
It caught our attention when we noticed big money going into the stocks this fund owns from 16th November 2012 to 28th January (Point L). Over this period it returned 18.7% in just 2 and a half months. It’s worth noting that over the same time frame the powerful Nasdaq Composite returned 11%, which demonstrates incredible outperformance from this fund. Ideally it should have been purchased at 250 on the 3rd March (Point M), however we bought it on the 12th March at 2.61. It then corrected 6.5% over the next four weeks (Point N) and the correction officially ended 7th May. Even though its performance since purchase has been mediocre, we still like it.
Fund D - 6.6% in 7 weeks
This powerful fund came into view after breaking out of a sideways base at 1.44 on 2nd January 2013 (Point O). It then moved up to 1.69 by the 11th March, resulting in a 17.3% return in just 13 weeks (Point P).
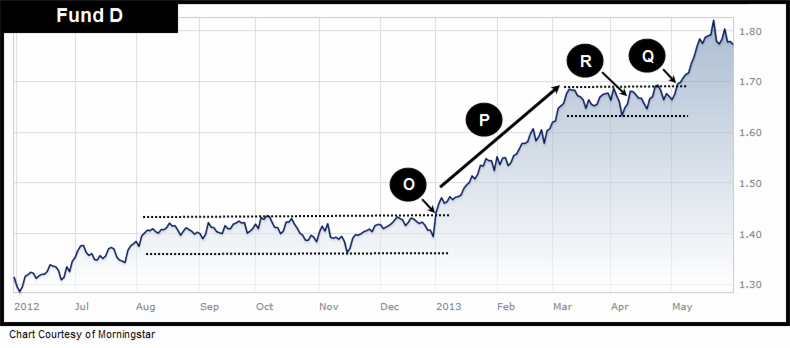
Over the same time frame the powerful Nasdaq Composite returned 7.7%, which once again demonstrates incredible outperformance from this fund. It then carved a bullish sideways base and the ideal breakout point was 170, which occurred on 5th May (Point Q). However, we got in one month early at a more favourable price of 1.66 on the 9th April (Point R). This fund has acted extremely well since its breakout and so far we are impressed by its behaviour – returning 6.6% in just 7 weeks.
Fund E
This fund popped up on our radars after breaking out of a saucer base at 56 on 20th December 2012 (Point S). It then moved up to 66 by 11th March, a 17.9% return in just less than 3 months (Point T). It then carved a bullish sideways base (Point U), with a breakout point of 67. This was the point where we bought in on April 9th (Point V) and from the breakout we saw a rapid 10% return (Point W) just before it topped out at the same time the Nikkei 225 reversed course.
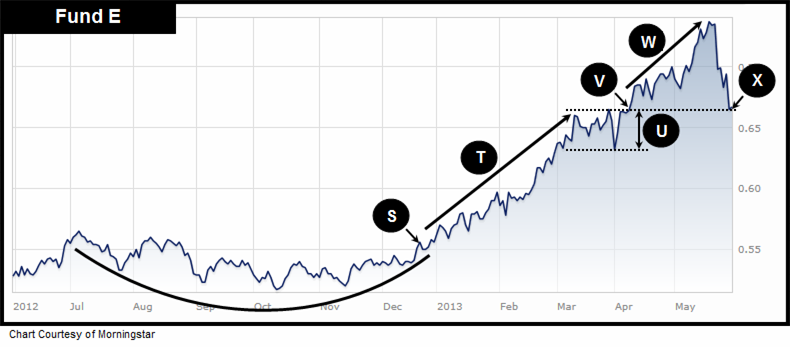
Due to the Nikkei recently having a mini crash, this fund is now correcting in line with the Japanese market and ideally it will find support at where we bought it (Point X). However, we are prepared for it to fall further due to it making a 42.3% six month return from November 14th 2012 to 20th May 2013. It has currently fallen 9.4% from its high, but because it made 42.3% over the last six months it seems reasonable that it could easily fall to the 60 price level before finding a solid footing. If it did drop to the 60 price level, it would mean its total correction off its high would be about 20%, which also seems normal after a 42.3% gallop. This means we are prepared for sitting in a possible temporary loss of 10-11%. However, if it dropped below 59 we would probably look at exiting.
Our outlook: The next two years and beyond
For 2013–2014, we still expect to see the FTSE 100 make a return of 30-35% and our aim as always will be to beat it. Year to date the Footsie is up 11.6% and we are currently sitting on a return of 12.6%. Beyond the next two years, we believe we’ll continue to experience solid performance from the equity markets, which means that if you are a long-term investor like us, and you stay in the game, the future is looking bright.
This information is taken from The Big Picture, to download a sample copy please just click here.
As always, if you have any questions or thoughts on the points covered in this post, please leave a comment below or connect with us @ISACO_ on Twitter.
About ISACO
ISACO is a specialist in ISA and SIPP Investment and the pioneer of ‘Shadow Investment’, a simple way to grow your ISA and SIPP. Together with our clients, we have £57 million actively invested in ISAs and pensions*.
Our personal investment service allows you to look over our shoulder and buy into exactly the same funds as we are buying. These are investment funds that we personally own and so you can be assured that they are good quality. We are proud to say that by ‘shadowing’ us, our clients have made an annual return of 12.5% per year over the last four years** versus the FTSE 100’s 7.4%.
We currently have close to 400 carefully selected clients. Most of them have over £100,000 actively invested and the majority are DIY investors such as business owners, self-employed professionals and corporate executives. We also have clients from the financial services sector such as IFAs, wealth managers and fund managers. ISACO Ltd is authorised and regulated by the Financial Conduct Authority (FCA). Our firm reference number is 525147.
* 15th November 2012: Internal estimation of total ISA and pension assets owned by ISACO Investment Team and ISACO premium clients.
** (31st December 2008 - 31st December 2012).
ISACO investment performance verified by Independent Executives Ltd.
To download our free report 'A Golden Opportunity' >>
To download our Shadow Investment brochure >>
To start your 14 day free 'no obligation' trial of Shadow Investment >>