 Throughout the year, come rain or shine, we love to watch the daily activity of the market’s best stocks. The reason we watch them like a hawk is because they tend to lead the market higher – and lead the market lower – before the general market catches on. This means that they are a very good indicator of which direction the market is likely to head next.
If you would like to know more, why not download our latest free report Gauging Stock Market Direction.
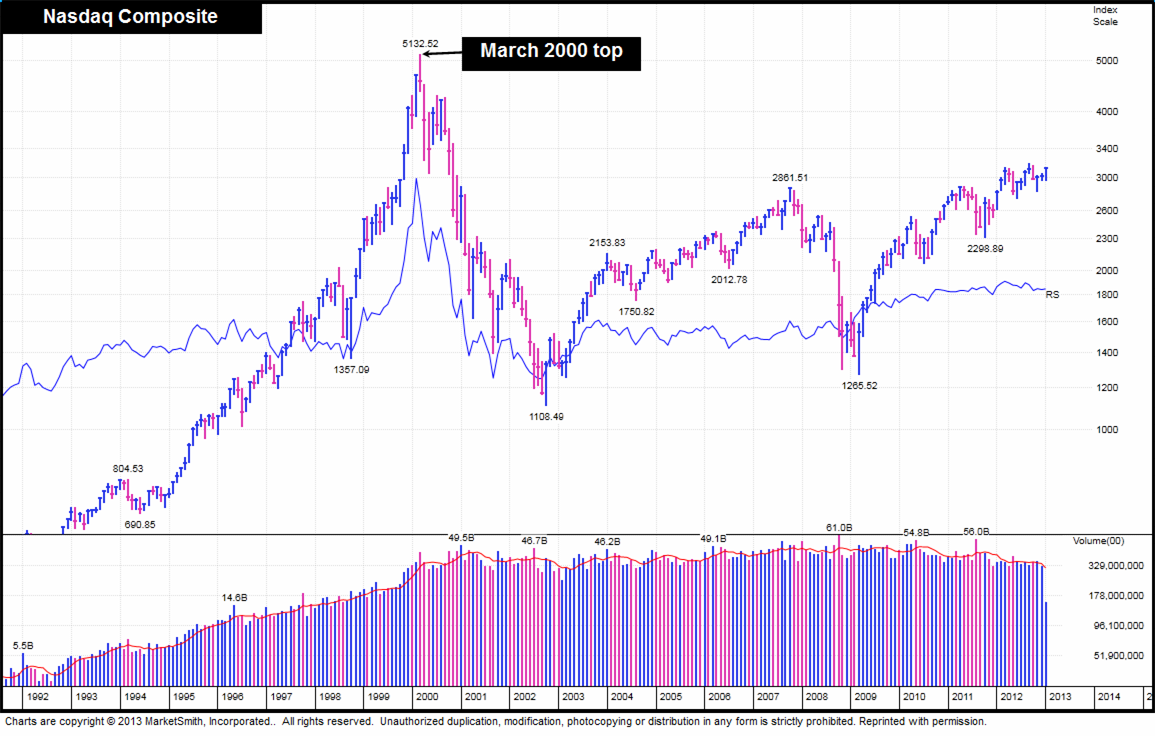
For example, back in 1999 during the technology bubble, leading stocks at the time were equities such as Yahoo! and Microsoft. As you can see on this 20 year chart of the NASDAQ Composite, the general market topped in March 2000.
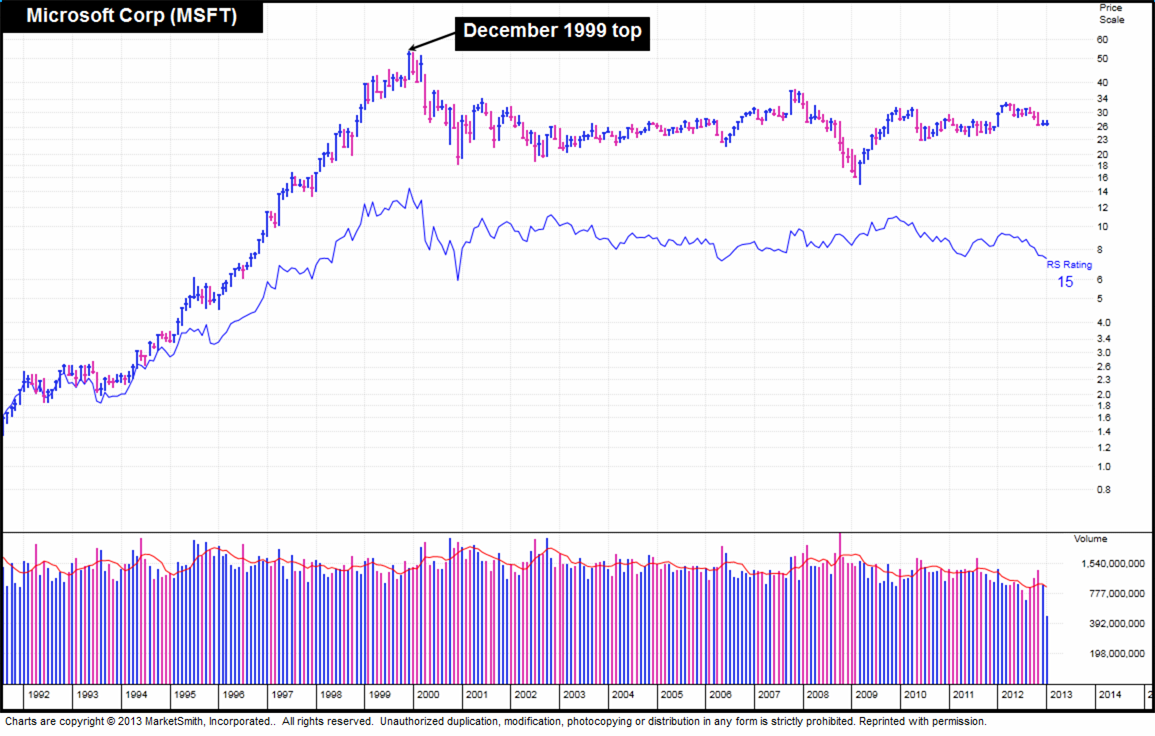
The market may have topped in March 2000, however Microsoft (ticker symbol: MSFT), a leading stock at the time, topped in December 1999, giving investors a signal that the bull market might be close to a top.
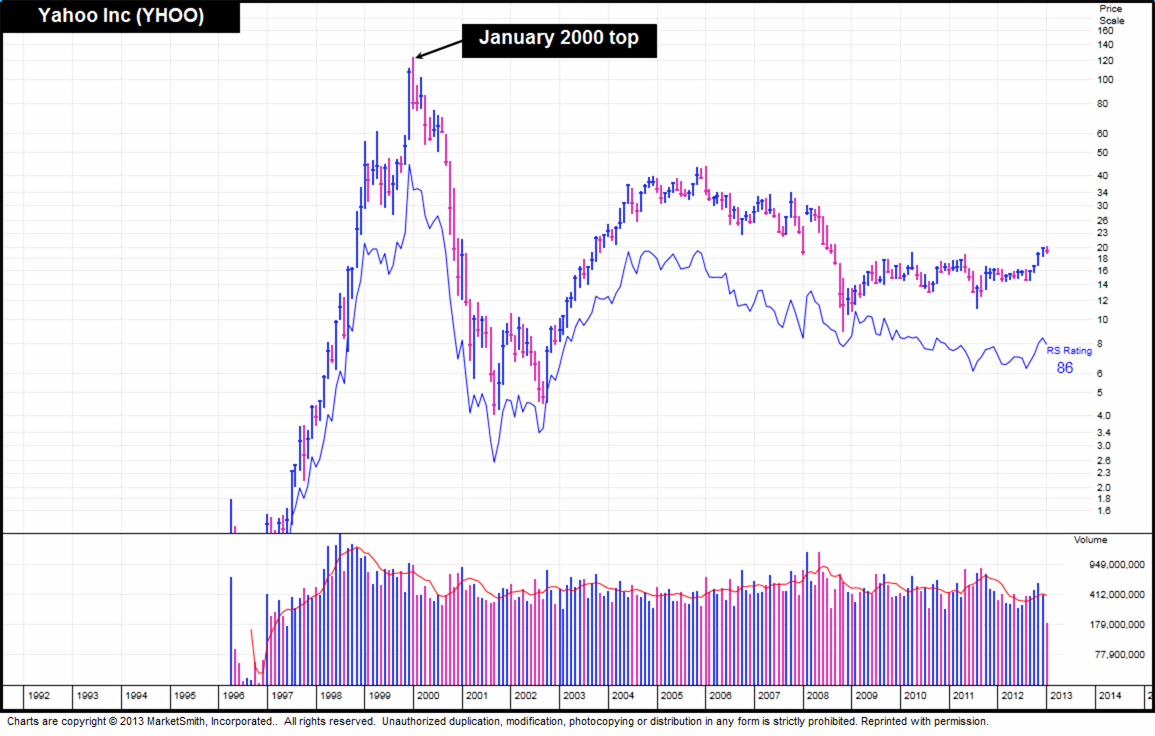
Yahoo! (ticker symbol: YHOO), another leader at the time, topped in January 2000, which was another clue that a top was coming.
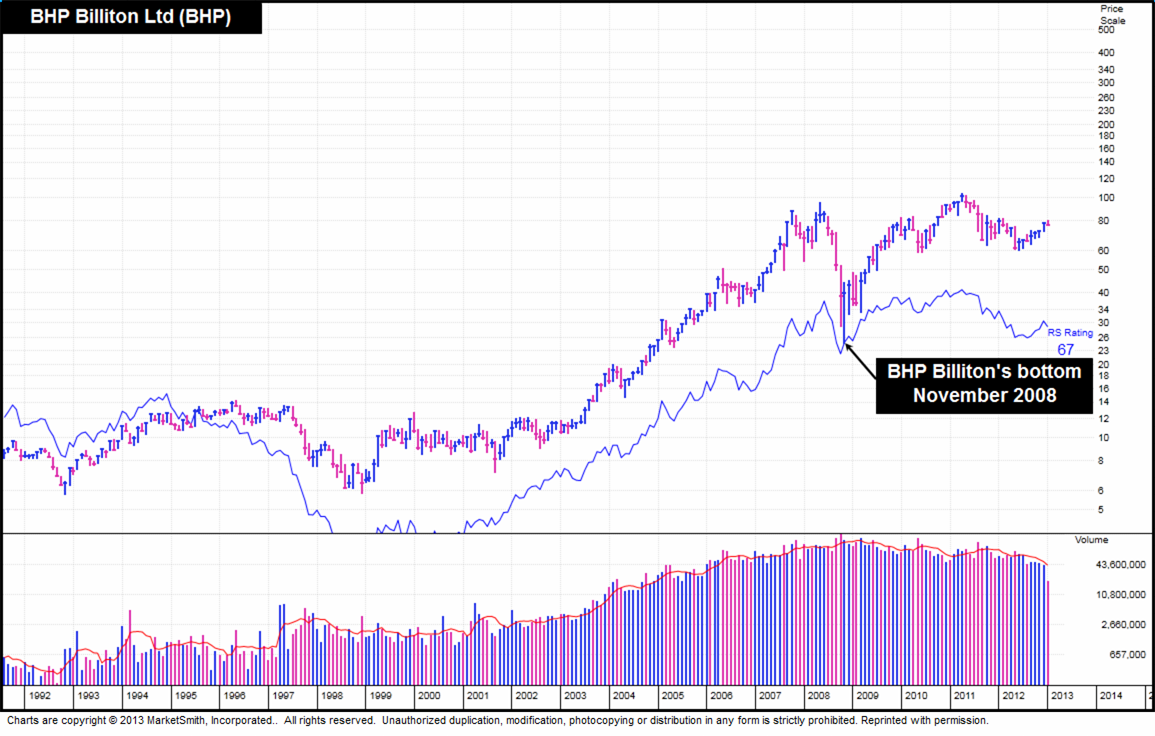
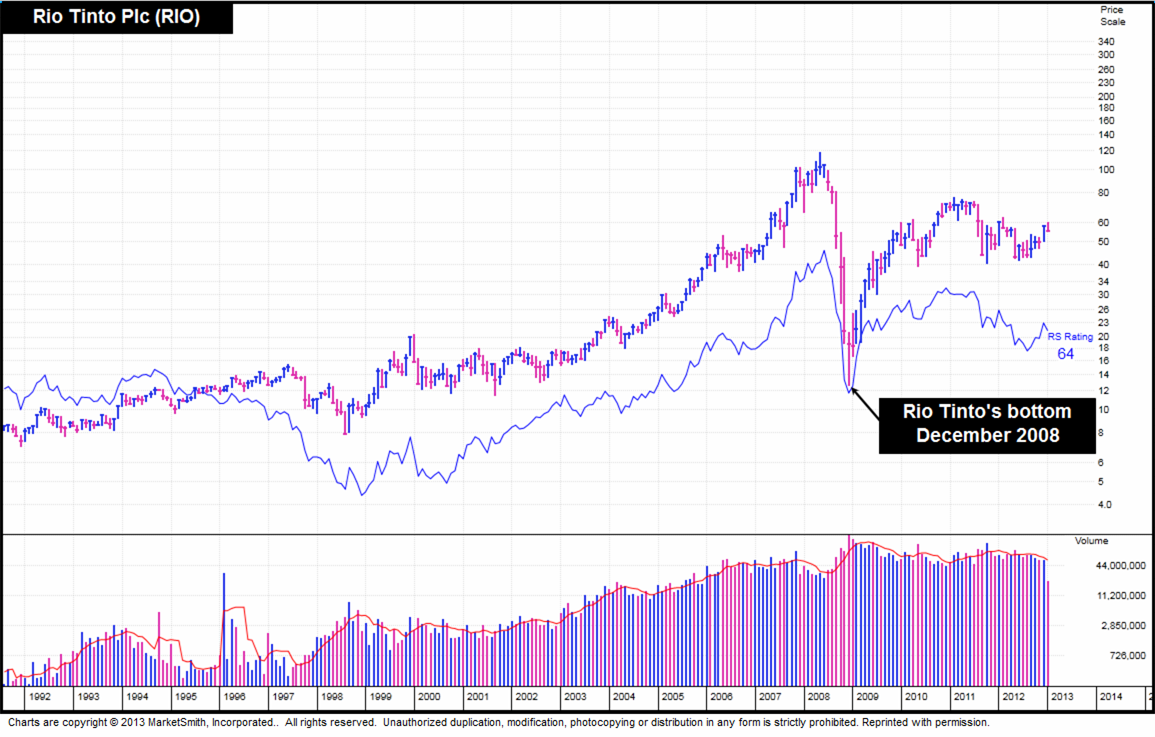
As I mentioned, it also happens on the flip side too. Stocks such as Rio Tinto (ticker symbol: RIO) and BHP Billiton (ticker symbol: BHP) were two of the leading stocks at the start of the bull market that began in 2009.
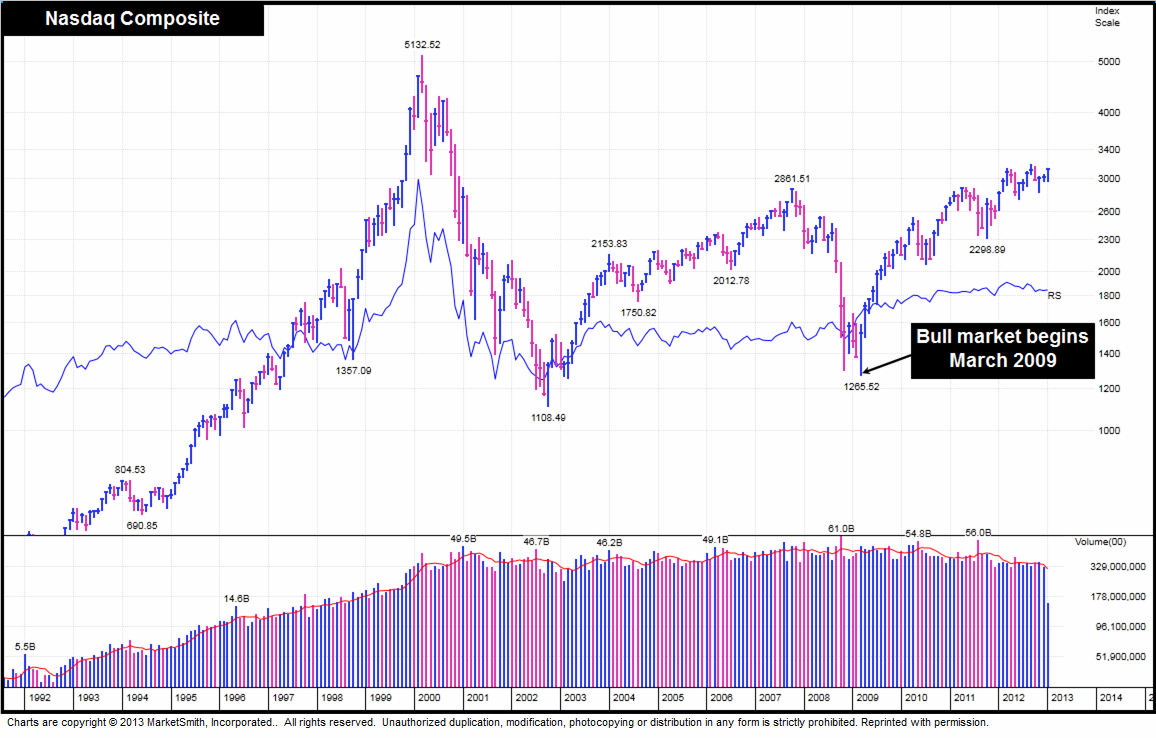
Therefore, it’s interesting to note that BHP Billiton bottomed in November 2008, four months before the market turned around.
It’s also interesting to see Rio Tinto (another leader in 2009 and 2010) bottoming out in December 2008, which was three months before the 2009 bull market began.
It’s also good to know that a leading stock can become a laggard stock. A leading stock is one with an RS (relative strength) rating of 80 or above and an EPS (earnings per share) rating of 80 or above. Stocks’ ratings change on a daily basis, which means it’s probably a good idea to always have a list of stocks that you class as leaders and continually work on adding new members to the list and removing stocks that no longer match your leading stock criteria.
As always, if you have any questions or thoughts on the points covered in this post, please leave a comment below or connect with us @ISACO_ on Twitter.
About ISACO
ISACO is a specialist in ISA and SIPP Investment and the pioneer of ‘Shadow Investment’, a simple way to grow your ISA and SIPP. Together with our clients, we have £57 million actively invested in ISAs and pensions*.
Our personal investment service allows you to look over our shoulder and buy into exactly the same funds as we are buying. These are investment funds that we personally own and so you can be assured that they are good quality. We are proud to say that by ‘shadowing’ us, our clients have made an annual return of 12.5% per year over the last four years** versus the FTSE 100’s 7.4%.
We currently have close to 400 carefully selected clients. Most of them have over £100,000 actively invested and the majority are DIY investors such as business owners, self-employed professionals and corporate executives. We also have clients from the financial services sector such as IFAs, wealth managers and fund managers. ISACO Ltd is authorised and regulated by the Financial Conduct Authority (FCA). Our firm reference number is 525147.
* 15th November 2012: Internal estimation of total ISA and pension assets owned by ISACO Investment Team and ISACO premium clients.
** (31st December 2008 - 31st December 2012).
ISACO investment performance verified by Independent Executives Ltd.
To download our free report 'A Golden Opportunity' >>
To download our Shadow Investment brochure >>
To start your 14 day free 'no obligation' trial of Shadow Investment >>