
In this post we'll take a look at the performance year to date of the funds in our portfolio.
This information is taken from The Big Picture, to download a sample copy please just click here.
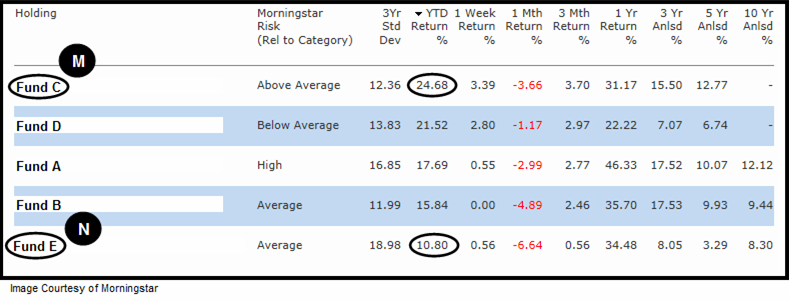
When you hold a number of funds, you are always going to have a winner (leader) and a loser (laggard). As you can see from the table below, currently our year to date leader is Fund C, currently up 24.68% (Point M) and our laggard is Fund E, up 10.8% (Point N).
A wild ride
It’s good to remind ourselves every once in a while that when you buy an adventurous fund, you are going to experience volatility just after buying it. A fund we own (Fund D) is a great example of what can happen just after buying and we view this erratic short-term behaviour as perfectly normal.
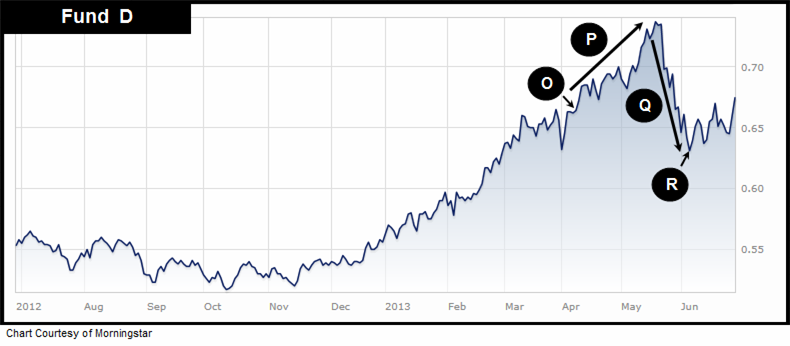
We bought it at a price of 67 on 9th April 2013 (Point O). Over the next five weeks it shot up 10.4% (Point P) but then corrected 14.9% (Point Q), before eventually bottoming out at 63 on 6th June 13 (Point R). This took us from being up 10.4% from the price we bought to being down 6%. Right now* it’s currently trading at 68, slightly above our buy price.
*Saturday 29th June 13
Look what happens to a £250,000 portfolio
Using percentages doesn’t always get the key points of the lesson across. However, when you use pound notes, it helps to give the example some emotional punch. For instance, if an investor had £250,000 invested in this fund, right after buying their account would have galloped up to £276,000 (10.4% gain) in just five weeks. However, the impressive gain was followed by a 14.9% correction down to £234,876.
Right now the illustrative £250,000 portfolio would currently be sitting at £253,750. To some inexperienced investors this activity just after buying may seem like abnormal behaviour. However, this is exactly how adventurous funds act and the majority of them move in the same direction as the general market. All you have to remember is that when the market corrects, funds correct too. So when you see your fund correcting, ask yourself a question. Is the market correcting right now? If it is, you then know why your fund is correcting. We’ve found that trying to avoid this short-term volatility is impossible, especially when seeking higher returns. Over our many years of investing, we’ve found that the best way to deal with volatility is to think long-term and try to ignore the inevitable short-term fluctuations.
Where will Fund D go from here?
In our opinion, right now* Fund D is more likely to go higher. Why? On 26th June, the Nikkei followed through on day ten of a new rally attempt, surging 2.96%. (Point S)
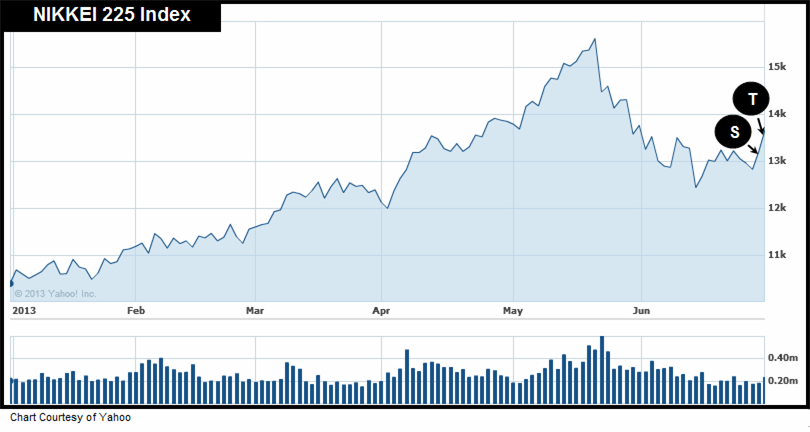
The following day the positive behaviour continued with a second follow though, this time with a price gain of 3.51% (Point T). That constituted a 2-day return of 6.6%! What does this mean? The action provides confirmation that Japan’s main index is most probably on the way back up. If this is true, our fund should benefit greatly from this trend change from down to up.
*Saturday 29th June 13
Two darlings: Fund A and Fund B
So far we’ve talked about three of our five funds, but what about the other two? We continue to be impressed with the performance of Fund A and Fund B. Fund A is currently*up 38.9% since purchasing it on 24th July 2012 and we are currently* sitting on a gain of 32.6% with Fund B – purchased on the same day.
*Saturday 29th June 13
Our outlook: The next two years and beyond
Over the next two years, we expect to see the FTSE 100 make a return of approximately 30-35% and our aim as always will be to beat it. Year to date the Footsie is up 5.4% and we are currently sitting on a return of 9.7%. Beyond the next two years, we believe we’ll continue to experience solid performance from the equity markets, which means that if you are a long-term investor like us, and you stay in the game, the future is looking bright.
As always, if you have any questions or thoughts on the points covered in this post, please leave a comment below or connect with us @ISACO_ on Twitter.
About ISACO
ISACO is a specialist in ISA and SIPP Investment and the pioneer of ‘Shadow Investment’, a simple way to grow your ISA and SIPP. Together with our clients, we have £57 million actively invested in ISAs and pensions*.
Our personal investment service allows you to look over our shoulder and buy into exactly the same funds as we are buying. These are investment funds that we personally own and so you can be assured that they are good quality. We are proud to say that by ‘shadowing’ us, our clients have made an annual return of 12.5% per year over the last four years** versus the FTSE 100’s 7.4%.
We currently have close to 400 carefully selected clients. Most of them have over £100,000 actively invested and the majority are DIY investors such as business owners, self-employed professionals and corporate executives. We also have clients from the financial services sector such as IFAs, wealth managers and fund managers. ISACO Ltd is authorised and regulated by the Financial Conduct Authority (FCA). Our firm reference number is 525147.
* 15th November 2012: Internal estimation of total ISA and pension assets owned by ISACO Investment Team and ISACO premium clients.
** (31st December 2008 - 31st December 2012).
ISACO investment performance verified by Independent Executives Ltd.
To download our free report 'A Golden Opportunity' >>
To download our Shadow Investment brochure >>
To start your 14 day free 'no obligation' trial of Shadow Investment >>