 We don’t always outperform the market but we are proud that over the last 12 months* we have beaten both the NASDAQ Composite and the FTSE 100.
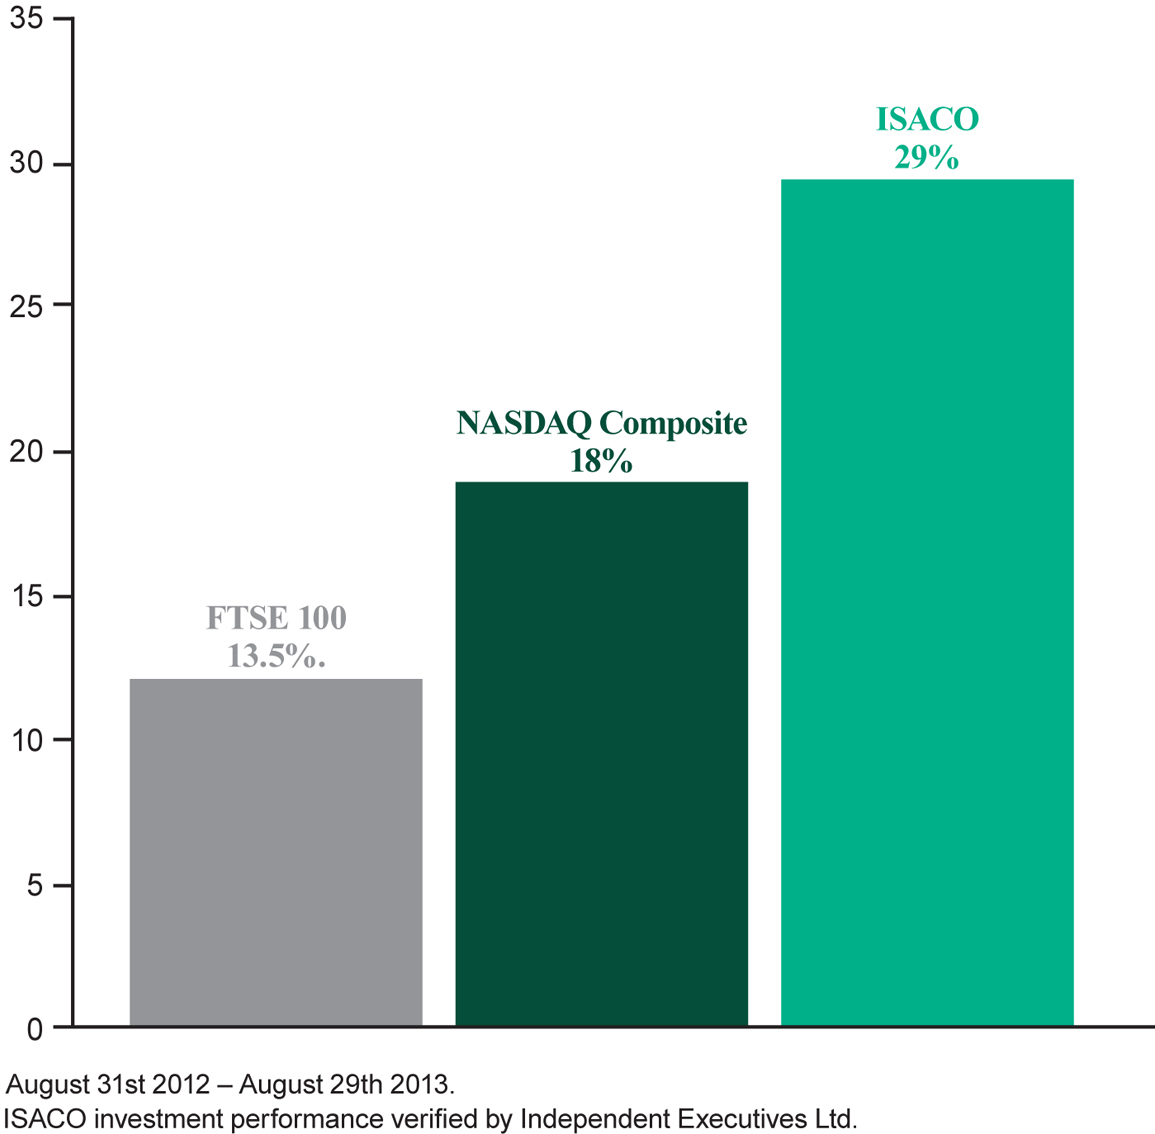
The bar chart shows you that over the last year the FTSE 100 jumped 13.5%, the NASDAQ Composite 18% and we’ve returned 29% – more than doubling the Footsie's 12 month return.
This information is taken from The Big Picture, to download a sample copy please just click here.
In the money flow
Some fund managers with great track records will unfortunately not be in sync with the market and not in the money flow. Why? Each fund manager has an objective and a mandate that they have to stick to, such as only investing in Japanese stocks, British stocks or possibly American stocks. Some managers’ mandates state that they can only invest in a particular sector, such as the technology sector or the basic resources sector. The important thing to understand here is that all fund managers have a brief and they have to stick to it.
This puts many top fund managers at a disadvantage because the big money can only flow into a handful of countries/sectors, rather than flowing into every country in the world and every given sector. This is one of the reasons why most top managers are never going to be able to constantly outperform the market every single year. That’s why we follow the mantra of aiming to invest in exceptional fund managers – managers who hold stocks where the big money is flowing right now.
Which of our funds is in the money flow?
The short-term performance of a fund is very important. It’s important because strong funds tend to get stronger and weak funds tend to get weaker. By keeping a close eye on short-term periods, it can help you act quickly should you notice that your fund is behaving poorly. The short-term periods of time that we like to measure are weekly, monthly and three monthly. We like to compare the returns versus the short-term performance of the NASDAQ Composite and the FTSE 100. On August 29th 2013, we took a good look at how the six funds we owned at the time had been acting over the last three months. This is what we discovered:
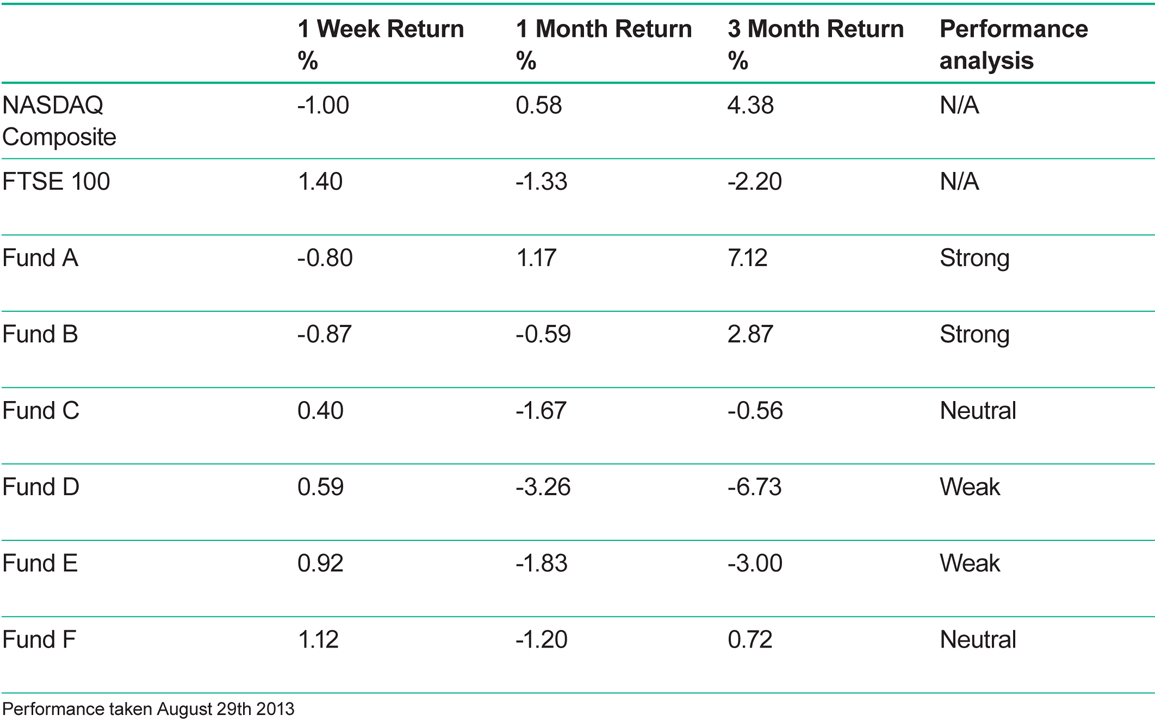
As soon as we spot weakness and underperformance in the short-term, it raises a red flag. As soon as a fund is red-flagged, we then watch it like a hawk. When we took these readings on August 29th 2013, we had two funds in our portfolio of this ilk; Fund D and Fund E.
On Saturday August 31st 2013 we made a switch
On Saturday August 31st 2013, we placed a switch order. We switched out of Fund E into cash. Normally when we make a change in our portfolio, we switch into other investments. However, at the time we made the change, there were four main reasons for switching into cash:
1) We couldn’t see any attractive investment opportunities.
2) We didn’t have safe entry points into the ‘strong’ investments we own.
3) The market was in a correction phase.
4) We were just about to enter what is historically a ‘bad’ month for equities.
Four reasons for exiting Fund E
We exited Fund E for four reasons.
-
Nikkei 225 weakness: On August 20th 2013 the Nikkei broke below key support at 13500. This was a bearish signal and our first red flag.
- Key support broke in Fund E’s chart pattern. The fund recently fell below some extremely strong support at the 96 price level, which was our second red flag.
- On Saturday August 31st 2013, Fund E was trading 8.8% below our buy price of 104. In keeping with good money management principles, we like to limit our losses.
- Fund E had been underperforming the NASDAQ Composite over the previous three months.
Our other five funds
We are still concerned about Fund D. On Saturday 31st August 2013, it was trading at 64.12 and our exit point is 62.50. If at some time in the near future the fund breaches our 62.50 price point, we will exit this one too. With regards to the other four funds that we own, we are happy with their recent performance, especially Fund A and Fund B.
Our outlook: 2013-2014 and beyond
At the beginning of this year, we said that we expect over the next two years to see the FTSE 100 make a return of approximately 30-35%. We also said that we expect to beat the FTSE 100 and we still stand behind that statement. So far we feel that we and the market are on track. We are currently sitting on a year to date gain of just short of 13%. Beyond the next two years, we believe we’ll continue to experience solid performance from the equity markets, which means that if you are a long-term investor like us, and you stay in the game, the future is looking bright.
This information is taken from The Big Picture, to download a sample copy please just click here.
As always, if you have any questions or thoughts on the points covered in this post, please leave a comment below or connect with us @ISACO_ on Twitter.
About ISACO
ISACO is a specialist in ISA and SIPP Investment and the pioneer of ‘Shadow Investment’, a simple way to grow your ISA and SIPP. Together with our clients, we have £57 million actively invested in ISAs and pensions**.
Our personal investment service allows you to look over our shoulder and buy into exactly the same funds as we are buying. These are investment funds that we personally own and so you can be assured that they are good quality. We are proud to say that by ‘shadowing’ us, our clients have made an annual return of 12.5% per year over the last four years*** versus the FTSE 100’s 7.4%.
We currently have close to 400 carefully selected clients. Most of them have over £100,000 actively invested and the majority are DIY investors such as business owners, self-employed professionals and corporate executives. We also have clients from the financial services sector such as IFAs, wealth managers and fund managers. ISACO Ltd is authorised and regulated by the Financial Conduct Authority (FCA). Our firm reference number is 525147.
* August 31st 2012 - August 29th 2013
** 15th November 2012: Internal estimation of total ISA and pension assets owned by ISACO Investment Team and ISACO premium clients.
*** 31st December 2008 - 31st December 2012.
ISACO investment performance verified by Independent Executives Ltd.
To download our free report 'A Golden Opportunity' >>
To download our Shadow Investment brochure >>
To start your 14 day free 'no obligation' trial of Shadow Investment >>