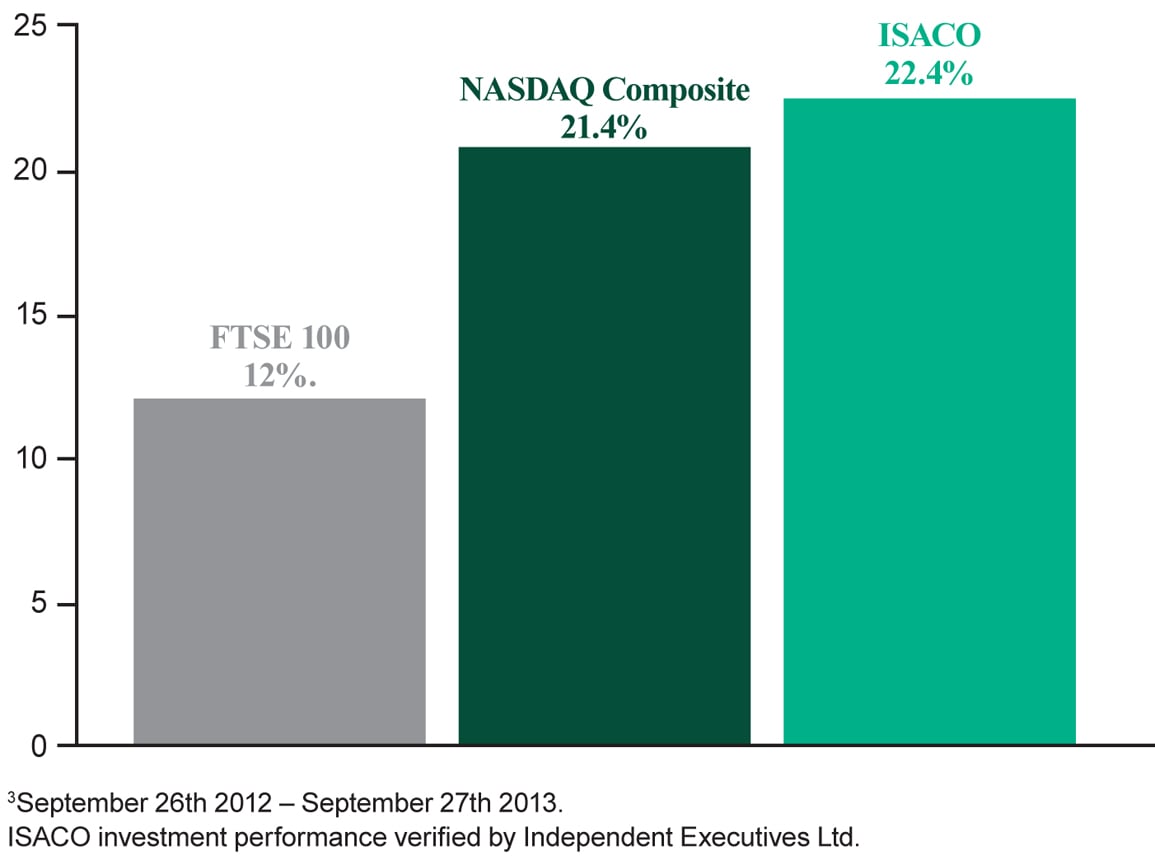
 We don’t always outperform the market but we are proud that over the last 12 months* we have beaten both the NASDAQ Composite and the FTSE 100.
The bar chart shows you that over the last year the FTSE 100 jumped 12%, the NASDAQ Composite gained 21.4% and we returned 22.4% – almost doubling the Footsie’s 12 month return.
This information is taken from The Big Picture, to download a sample copy please just click here.
In the money flow
Some fund managers with great track records will unfortunately not be in sync with the market and not in the money flow. Why? Each fund manager has an objective and a mandate that they have to stick to, such as only investing in Japanese stocks, British stocks or possibly American stocks. Some managers’ mandates state that they can only invest in a particular sector, such as the technology sector or the basic resources sector. The important thing to understand here is that all fund managers have a brief and they have to stick to it.
This puts many top fund managers at a disadvantage because the big money can only flow into a handful of countries/sectors, rather than flowing into every country in the world and every given sector. This is one of the reasons why most top managers are never going to be able to constantly outperform the market every single year. That’s why you have to be active. Therefore our mantra is to aim to invest in exceptional fund managers – managers who hold stocks where the big money is flowing right now.
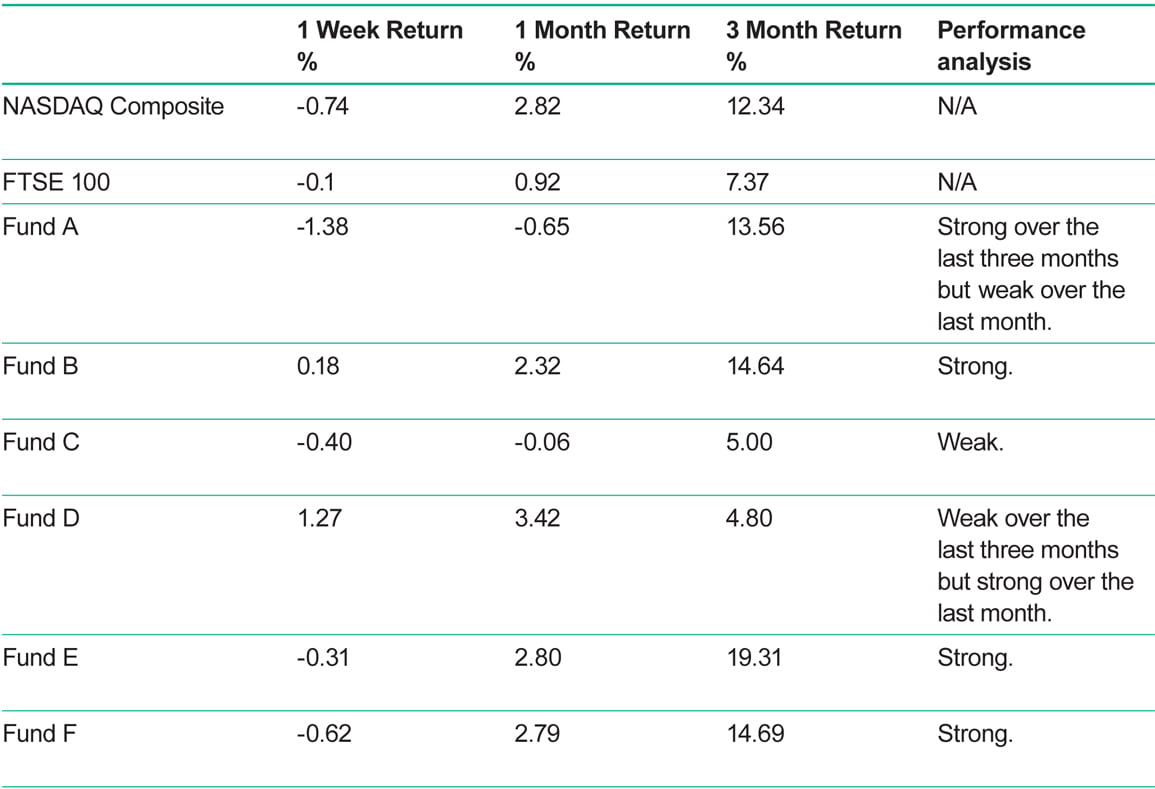
Which of our funds are in the money flow?
The short-term performance of a fund is very important. It’s vital because strong funds tend to get stronger and weak funds tend to get weaker. By keeping a close eye on short-term periods, it can help you act quickly should you notice that your fund is behaving poorly. The short-term periods of time that we like to measure are weekly, monthly and three monthly. We like to compare the returns versus the short-term performance of the NASDAQ Composite and the FTSE 100. On September 26th 2013, we took a good look at how the six funds we own had been acting over the last three months. This is what we discovered:
Red flag raised: Two funds to watch closely
As soon as we spot weakness and underperformance in the short-term, it raises a red flag. As soon as a fund is red-flagged, we then watch it like a hawk. When we took these readings on September 26th 2013, we had two funds in our portfolio of this ilk. The worst offender was Fund C, which had been weak over all three time periods. This is a fund that really does need to pull its socks up over the next four weeks or we may consider reducing our holding or completing exiting. The other underperformer was surprisingly one of our recent darling funds, Fund A. Over the three months it had performed well, but over the last month it had underperformed the market.
The good news is that when we conducted the analysis, over the previous month money had been flowing back into Fund D – which as you probably know had previously been trading in a danger zone. Plus our other three funds had all been strong on a weekly, monthly and three monthly basis when compared to the market.
Valuable lessons for the astute investor
Our 3 takeaway lessons from this performance analysis are:
- Be active: Always monitor your funds short term performance versus the market indexes such as the FTSE 100 and the NASDAQ Composite. Ideally they should be outperforming on a weekly, monthly and three monthly basis.
- Be flexible: You are never going to get everything perfect. Some funds will perform well and others won’t. This should be seen as normal and natural.
- Think ‘total return’: Don’t get hung up on poor performing funds. Instead focus on your ‘total’ return, which is the return you are getting from your full portfolio and not individual funds. Ideally you want to be beating the FTSE 100’s performance and, if you are, you are doing something right.
On Saturday September 14th we made a switch
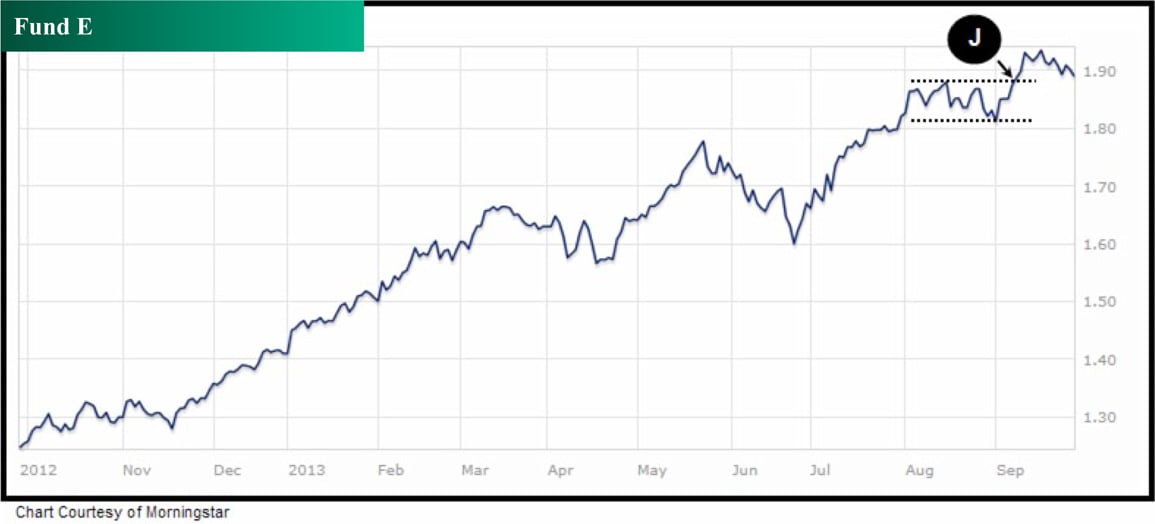
On Saturday September 14th 2013, we placed a switch order. We switched out of cash (ISA Cash Park/SIPP Bank Account) into Fund E. We decided to purchase for three reasons:
1) The fund manager: CLASSIFIED, the person who has been managing the fund since 2008 has a long-term track record of ‘beating’ the market. His performance from 2009 to the present date has been phenomenal.
2) Momentum: The fund’s recent price action has been impressive and at the time of our analysis, you could see that it had clearly been fighting (and beating) the market during the recent correction period.
3) Chart pattern: It’s recently just broke out (Point J) of a five week sideways base which we see as the ‘optimum’ time to buy. Ideally we like to buy when a fund is not extended 5% or more past its buy point. The breakout point of this fund was 188.5 and our trade was executed at a price of 192, which means we hit the mark.
This information is taken from The Big Picture, to download a sample copy please just click here.
As always, if you have any questions or thoughts on the points covered in this post, please leave a comment below or connect with us @ISACO_ on Twitter.
About ISACO
ISACO is a specialist in ISA and SIPP Investment and the pioneer of ‘Shadow Investment’, a simple way to grow your ISA and SIPP. Together with our clients, we have £57 million actively invested in ISAs and pensions**.
Our personal investment service allows you to look over our shoulder and buy into exactly the same funds as we are buying. These are investment funds that we personally own and so you can be assured that they are good quality. We are proud to say that by ‘shadowing’ us, our clients have made an annual return of 12.5% per year over the last four years*** versus the FTSE 100’s 7.4%.
We currently have close to 400 carefully selected clients. Most of them have over £100,000 actively invested and the majority are DIY investors such as business owners, self-employed professionals and corporate executives. We also have clients from the financial services sector such as IFAs, wealth managers and fund managers. ISACO Ltd is authorised and regulated by the Financial Conduct Authority (FCA). Our firm reference number is 525147.
* September 26th 2012 - September 27th 2013.
** November 15th 2012: Internal estimation of total ISA and pension assets owned by ISACO Investment Team and ISACO premium clients.
*** December 31st 2008 - December 31st 2012.
ISACO investment performance verified by Independent Executives Ltd.
To download our free report 'A Golden Opportunity' >>
To download our Shadow Investment brochure >>
To start your 14 day free 'no obligation' trial of Shadow Investment >>