 Have you ever wondered how you can find a good fund? In this new series of posts, we're going to take you through a tutorial that follows the process we use.
The website that we like to use when searching for the best funds is Morningstar. You can find it by going to www.morningstar.co.uk. Before you invest, I suggest you aim to find out if we are in a bull market or a bear market and one way you can do this is by looking at an index chart. Which index or indexes you choose to look at to help you track the market is your own decision. However, our favourite, is the NASDAQ Composite.
Bull market or bear market? Where are we?
For the purpose of this tutorial, it’s important for you to be aware that we took all the screenshots on August 27th 2013. As you can see on this 20 year chart of the NASDAQ Composite, the present bull market started back in March 2009 (Point A) and since then, it’s clearly formed a strong uptrend (Point B).
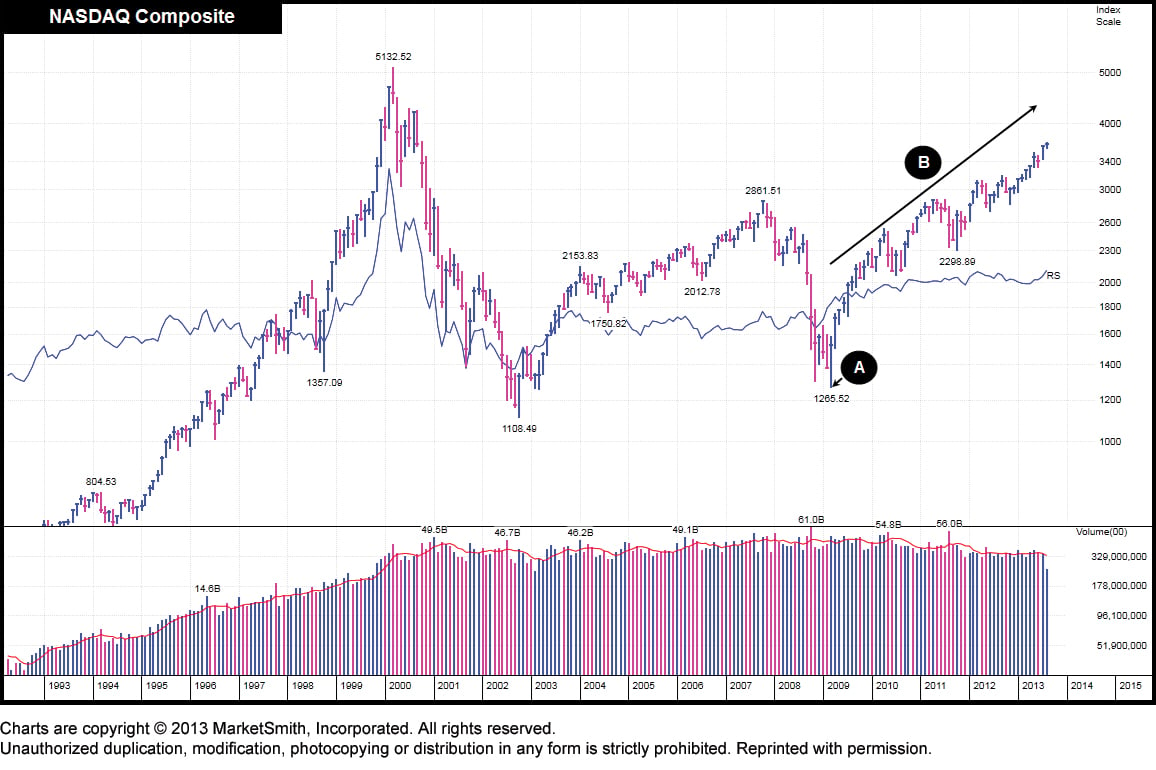
Keep this in mind, because when we do our searches on Morningstar we’ll be looking at which funds have performed best over the last five years. We say five years because when we took these screenshots, the bull market had been running for just under four and a half years.
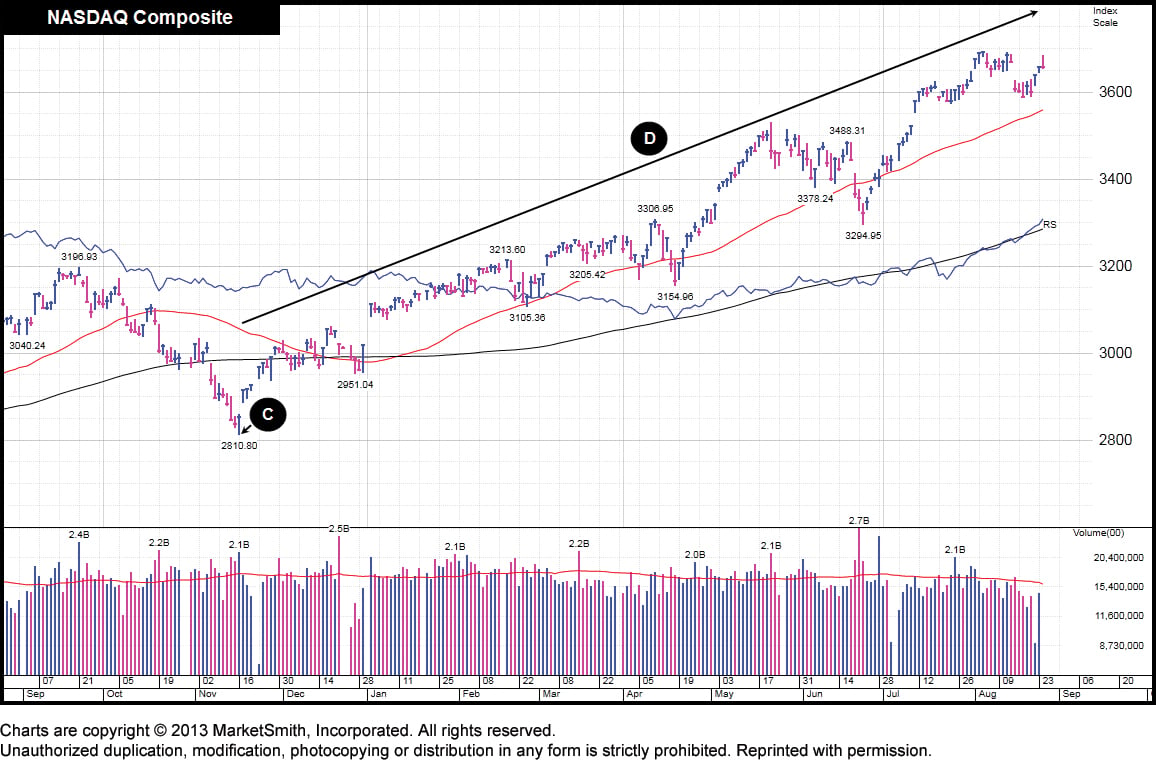
On this 12 month chart of the NASDAQ Composite, there is a clear uptrend. The uptrend starts November 16th 2012 (Point C) and is currently nine months old (Point D).
The facts so far about the market:
- The market had been in an uptrend for just under four and a half years.
- The market had been in an uptrend over the last nine months.
Just before we move on, we want you to make a mental note: The gain made by the NASDAQ over the previous nine months was 30.1%. We’ll be using this as a benchmark later so that we can measure the nine month gain against the fund’s performance over this same period.
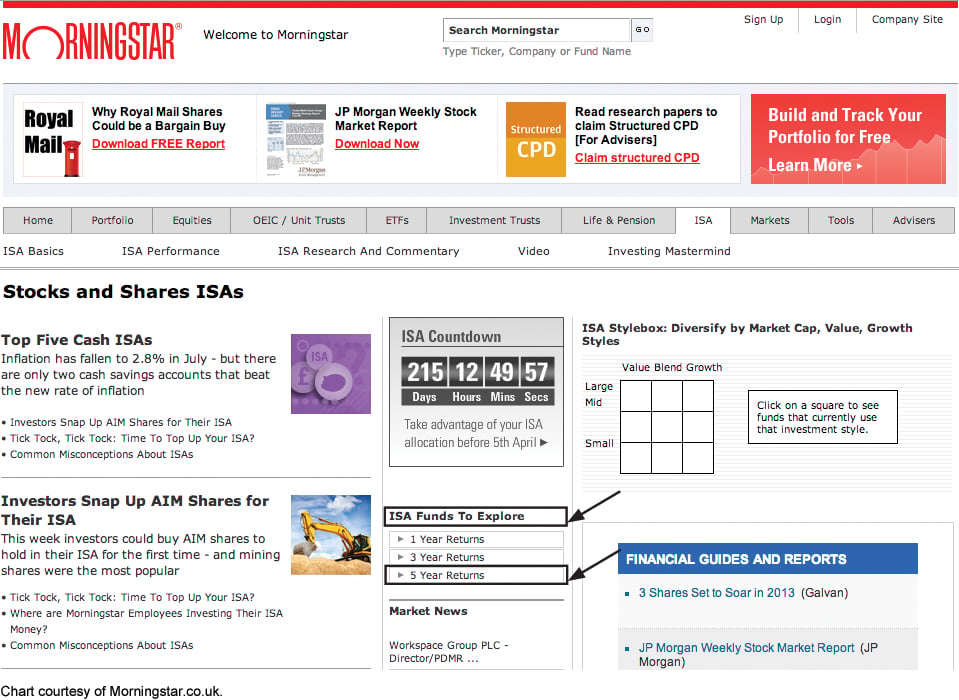
Morningstar home page
This is Morningstar’s home page. To start our search we click on the ‘ISA’ tab. We do this because it’s not possible to purchase some funds within a stocks and shares ISA. We therefore want to make sure that when we conduct our searches, all the funds we’ll be looking at are ‘ISA friendly’.

ISA Funds to Explore
As you discovered earlier, the market had been in a bull market for almost five years and so next, where it says ‘ISA Funds To Explore’, we are going to look at the ISA funds that have performed the best over the last 5 years. We can do that by clicking on the tab that says ‘5 Year Returns’.
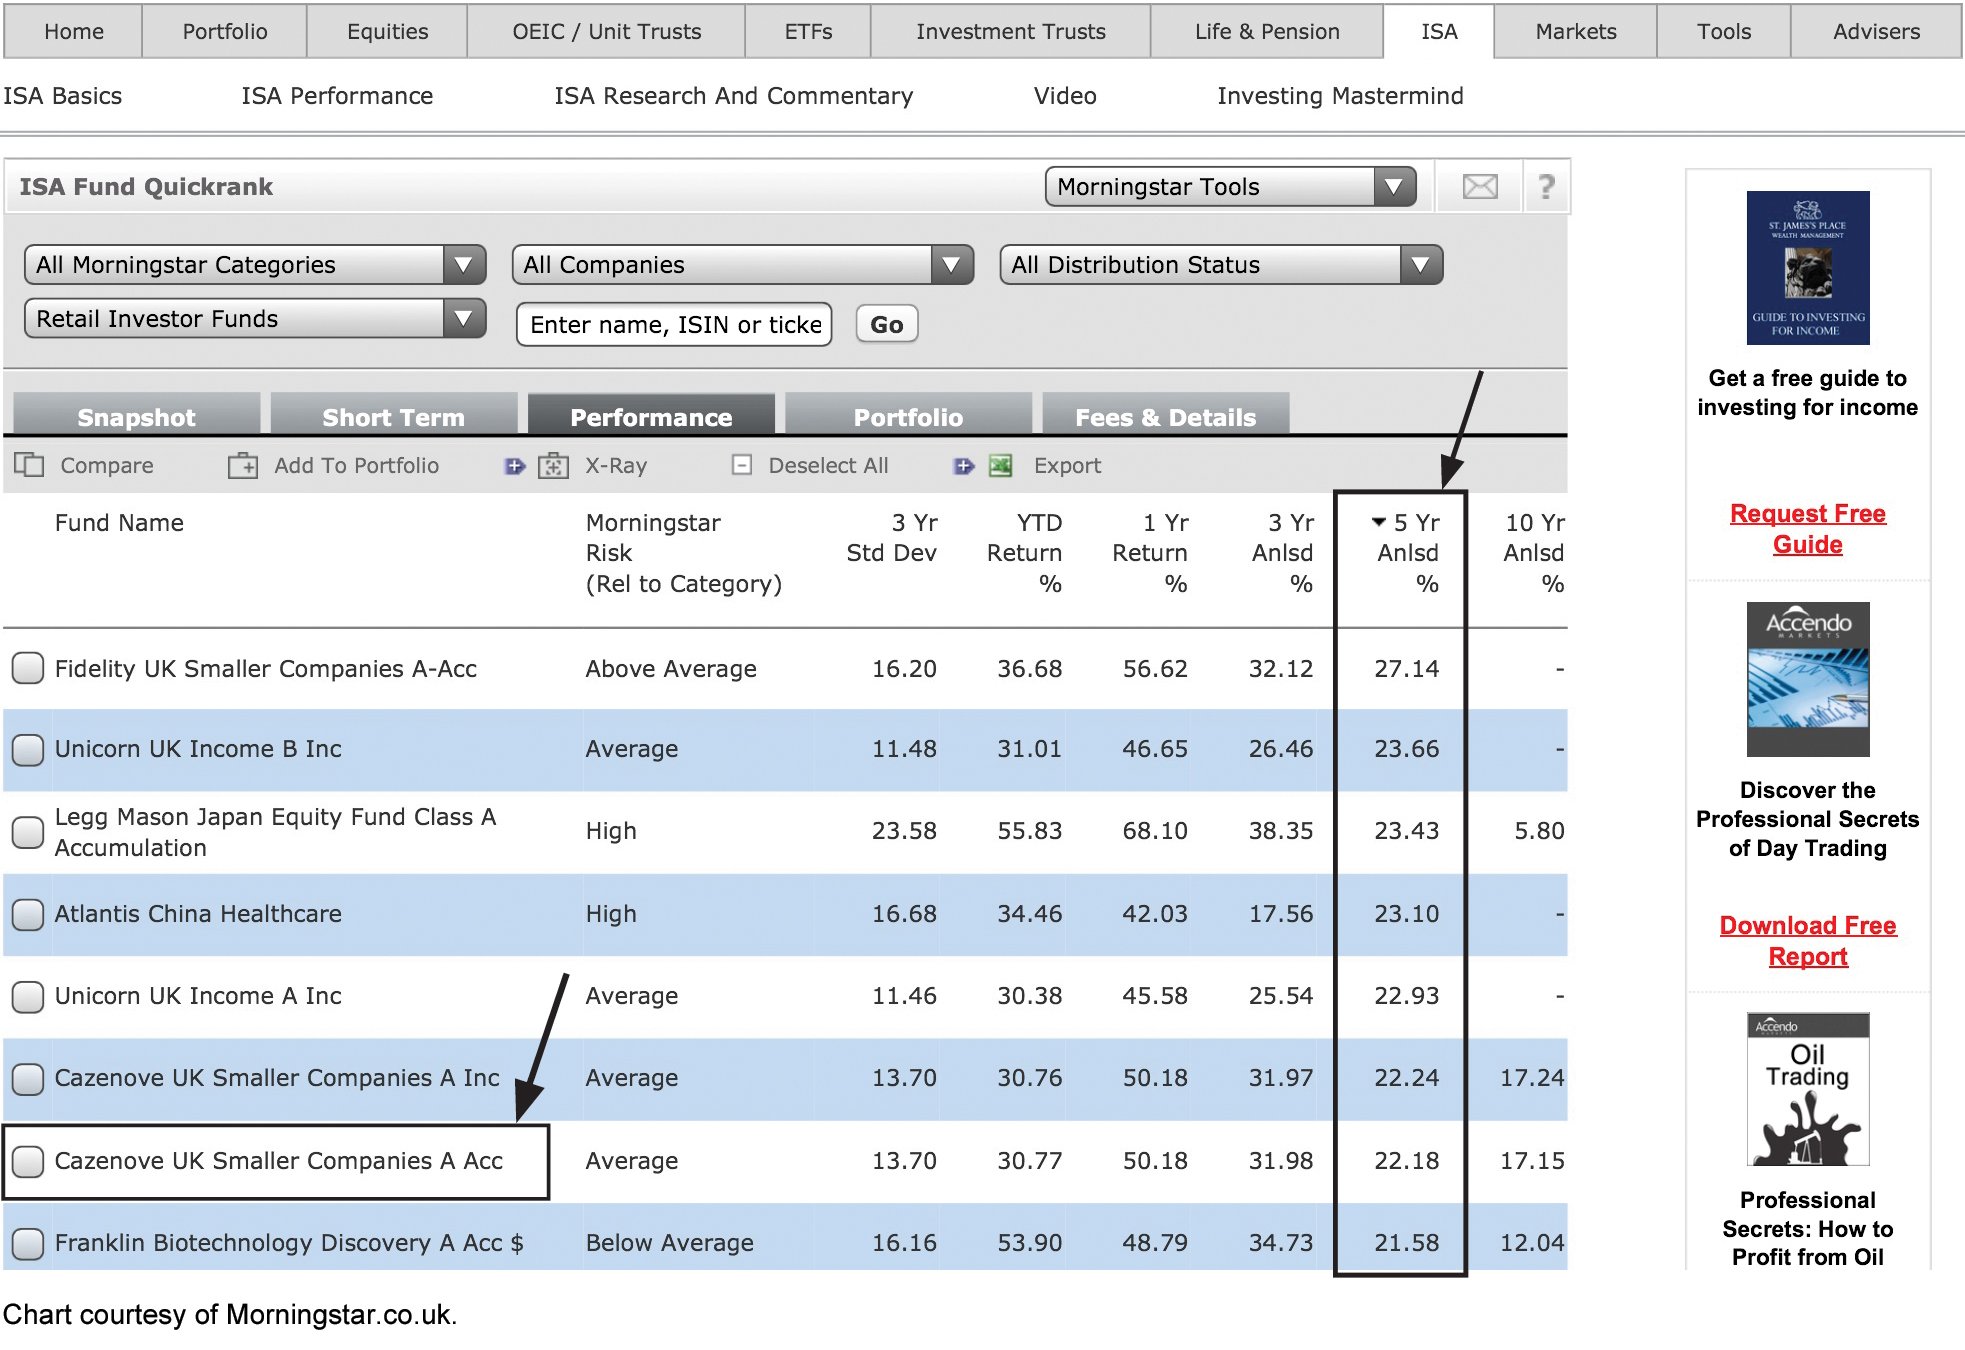
5 Year Performance
On this next image, you see the highest ranking funds in terms of 5 year performance. We could look at any of these funds on this list however we are going to view one that we know well. It’s called the Cazenove UK Smaller Companies A Acc. Let’s take a closer look.
Overview Page
Here you can see what Morningstar call the ‘Overview’ page of the fund.
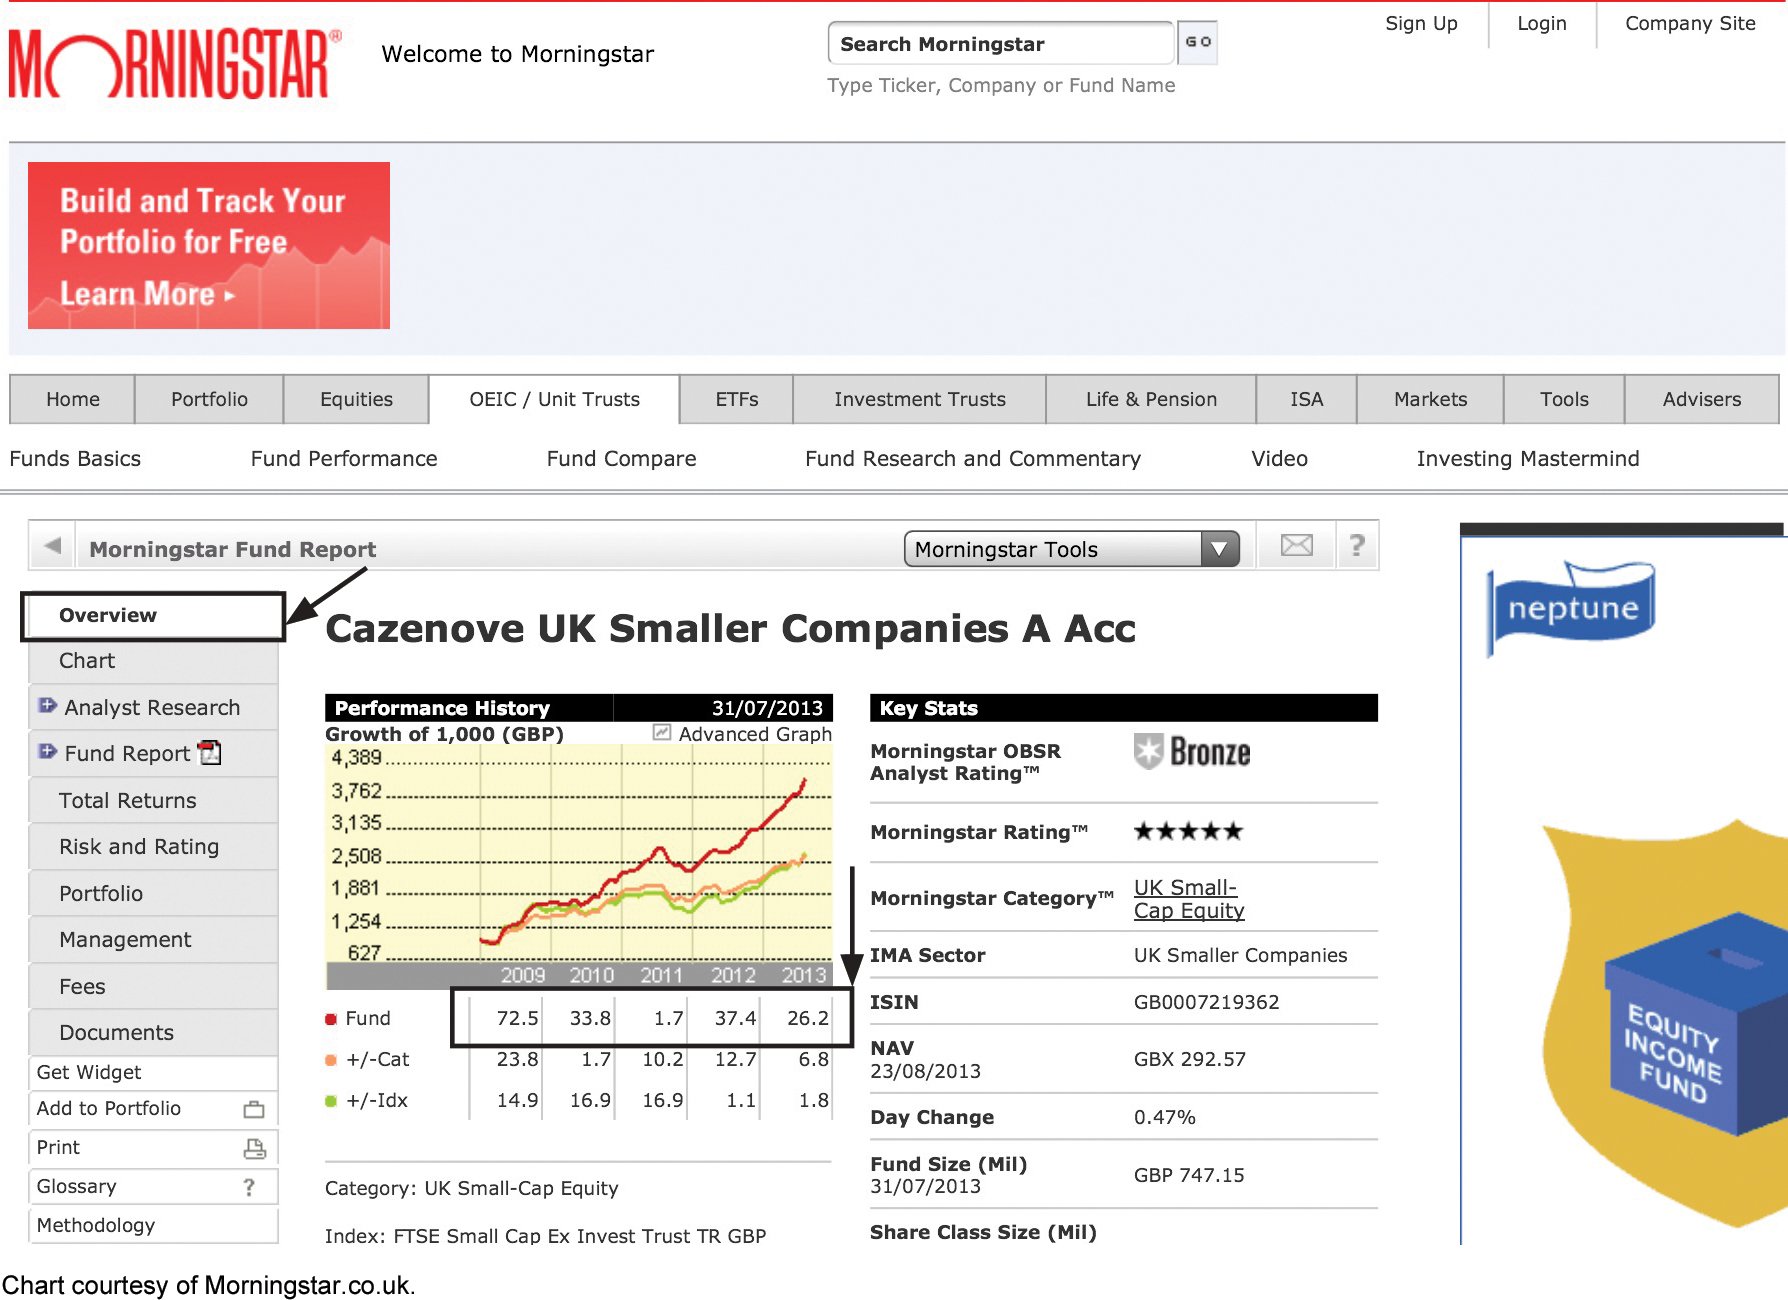
The first thing we focus on when searching for a fund, which we believe to be the most important part of fund selection, is the fund’s past performance. We start off by looking at how it has performed since the bull market began. As you can see, it returned 72.5% in 2009, 33.8% in 2010, 1.7% in 2011, 37.4% in 2012 and, year to date in 2013, it had made a gain of 26.2%.
When you punch those annual return figures into a calculator, you discover that the fund had made a total return of 307%. This is what you’d class as extremely impressive performance. The NASDAQ Composite over the same period had made a return of 43.9% in 2009, 16.9% in 2010, -5.6% in 2011, 15.9% in 2012 and, when this screenshot was taken, it had made a year to date return of 21.1%.
That gives the NASDAQ a total return of 122.9% over the same period. This comparison of total returns between the fund and the NASDAQ Composite tells us that over the four and a half year bull market period, the Cazenove UK Smaller Companies A Acc fund had easily beaten one of the world’s strongest indexes – so far so good.
In our next post in this series, we'll continue on with this tutorial.
As always, if you have any questions or thoughts on the points covered in this post, please leave a comment below or connect with us @ISACO_ on Twitter.
About ISACO
ISACO is a specialist in ISA and SIPP Investment and the pioneer of ‘Shadow Investment’, a simple way to grow your ISA and SIPP. Together with our clients, we have £57 million actively invested in ISAs and pensions*.
Our personal investment service allows you to look over our shoulder and buy into exactly the same funds as we are buying. These are investment funds that we personally own and so you can be assured that they are good quality. We are proud to say that by ‘shadowing’ us, our clients have made an annual return of 12.5% per year over the last four years** versus the FTSE 100’s 7.4%.
We currently have close to 400 carefully selected clients. Most of them have over £100,000 actively invested and the majority are DIY investors such as business owners, self-employed professionals and corporate executives. We also have clients from the financial services sector such as IFAs, wealth managers and fund managers. ISACO Ltd is authorised and regulated by the Financial Conduct Authority (FCA). Our firm reference number is 525147.
* 15th November 2012: Internal estimation of total ISA and pension assets owned by ISACO Investment Team and ISACO premium clients.
** 31st December 2008 - 31st December 2012.
ISACO investment performance verified by Independent Executives Ltd.
To download our free report 'A Golden Opportunity' >>
To download our Shadow Investment brochure >>
To start your 14 day free 'no obligation' trial of Shadow Investment >>