We don’t always outperform the market but we are proud that since the start of this year* we have beaten the FTSE 100 by quite a margin. The bar chart shows you that the FTSE 100 has so far gained 14.9% and we have returned 20.8%.
This information is taken from The Big Picture, to download a sample copy please just click here.
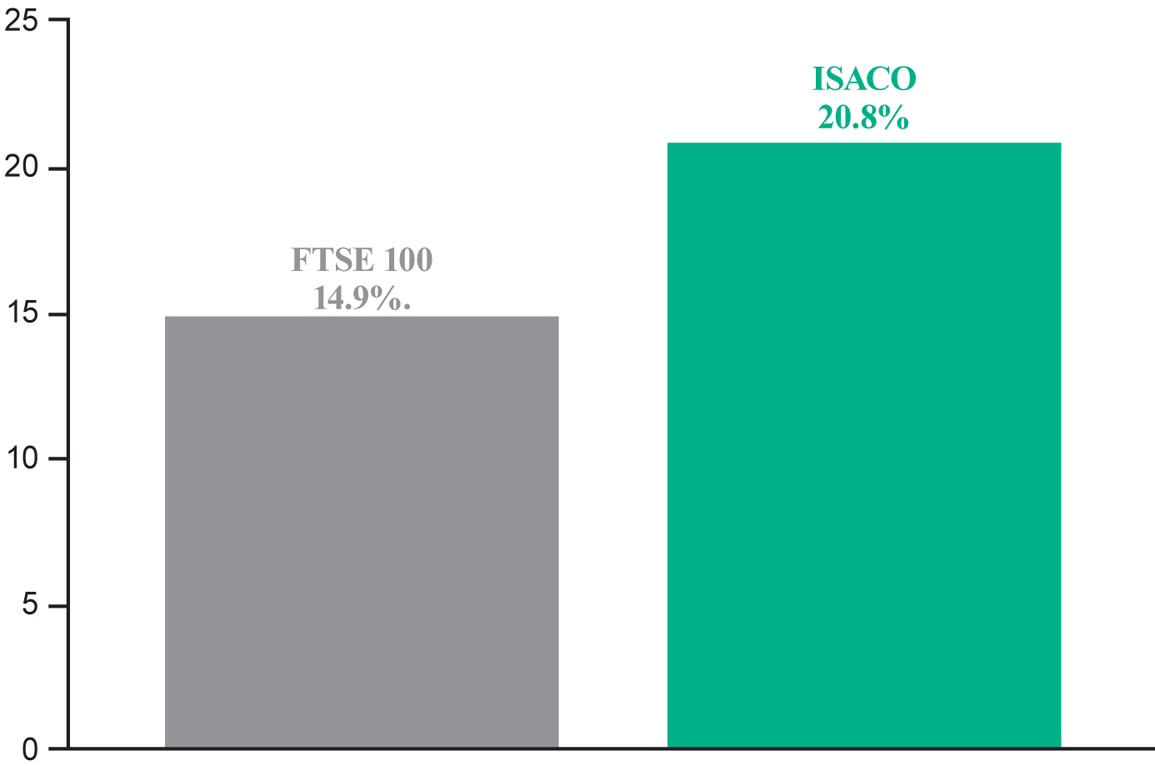
*January 1st 2013 - October 31st 2013
ISACO investment performance verified by Independent Executives Ltd
Which of our funds are in the money flow?
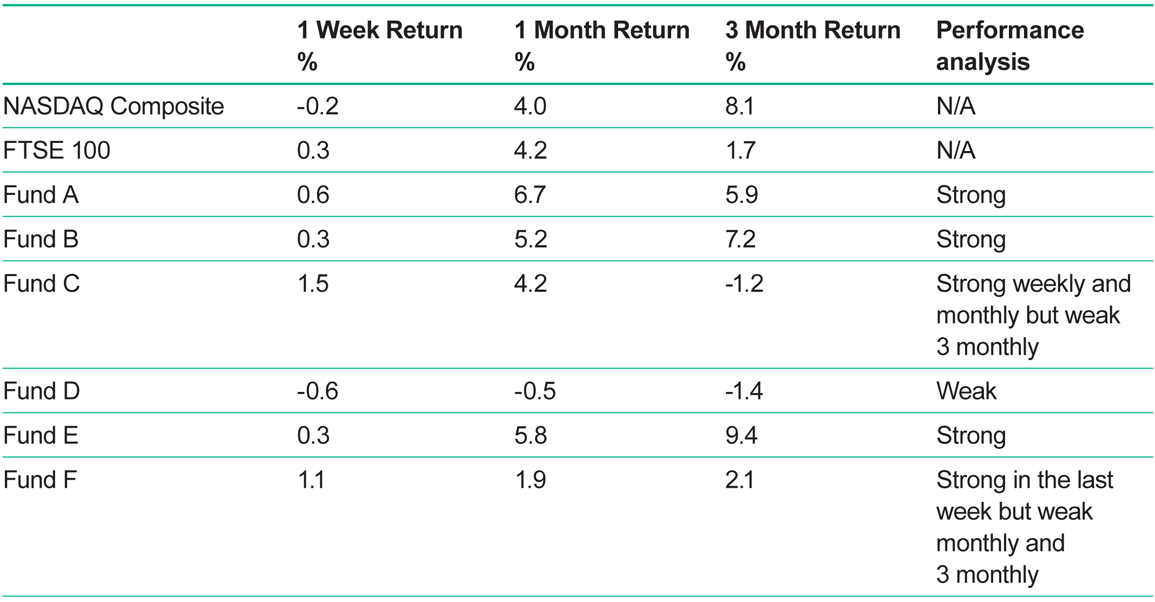
In our opinion, the short-term performance of a fund is very important. It’s vital because we’ve noticed that strong funds tend to get stronger and weak funds tend to get weaker. By keeping a close eye on short-term periods, it can help you act quickly should you notice that your fund is behaving poorly. The short-term periods of time that we like to measure are weekly, monthly and three monthly. We like to compare the returns versus the short-term performance of the NASDAQ Composite and the FTSE 100. On November 1st 2013, we took a good look at how the six funds we own had been acting over the last three months. This is what we discovered:
Two funds to keep a close eye on
Last month the two funds we had to watch carefully were Fund C and Fund A. We are pleased to say that both of them are currently looking much better. Over the month both funds outperformed, which means for now they have come off our ‘red flag’ radar. However two others have raised a red flag and are now under our watchful eye due to their recent underperformance. Fund F has not performed well over the last month or three months however it has behaved well over the last week. The worst offender is Fund D, which has been struggling in all three periods measured. From here, we’ll keep a close eye on these two to see if they can redeem themselves over the month of November.
Patiently waiting for Nikkei 225 to break above 15000
Below is a 1-year chart of the Nikkei 225. As you can see, since the beginning of July this year it has been travelling sideways (Point K). However, notice it has been bullishly making higher lows (Point L) since it bottomed in the middle of June (Point M).
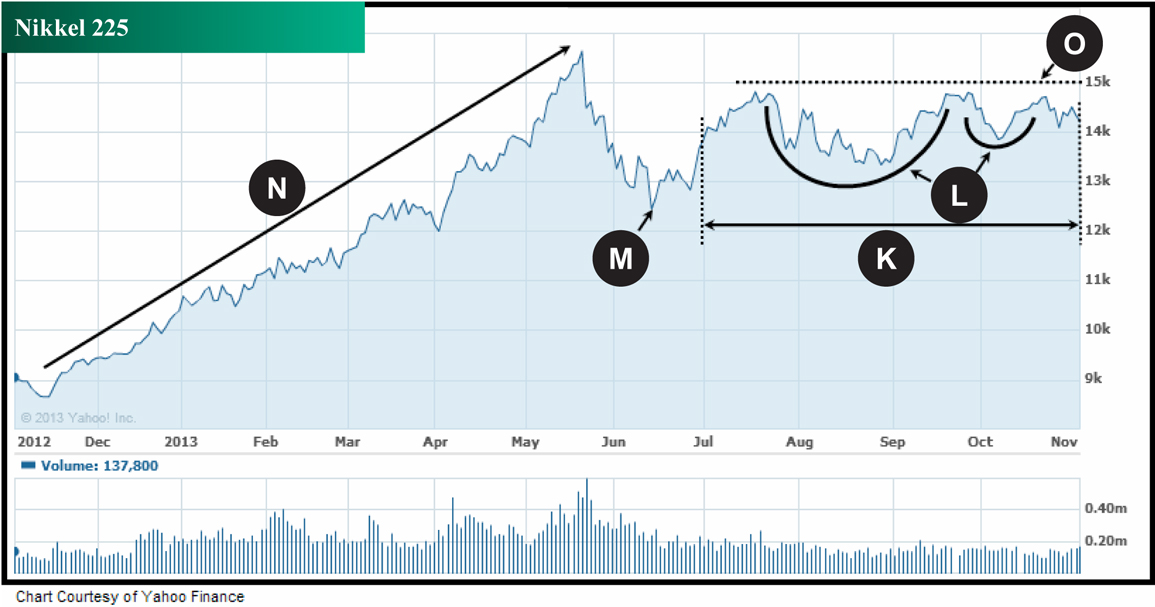
This index needed to consolidate and rest because it was so strong from November 2012 to May 2013 (Point N) and that’s exactly what it’s doing right now. We see this behaviour as perfectly normal and natural. Ideally, what we want to see happen from here is it successfully breaking above the 15000 level (Point O) because if it does, our current weak performing Fund D will likely follow suit. In fact, if the Nikkei does break above 15000, we think our lagging fund could really move and that’s why for now we are happy to hold onto it for a little longer.
Our outlook: 2013-2014 and beyond
At the beginning of this year, we said that we expect over the next two years to see the FTSE 100 make a return of approximately 30-35%. We also said that we expect to beat the FTSE 100 and we still stand behind that statement. So far we feel that we and the market are on track. As you heard before, we are currently sitting on a fairly respectable year to date gain of just over 20% and right now we are entering historically the three strongest months for the market; November, December and January. Beyond the next two years, we believe we’ll continue to experience solid performance from the equity markets, which means that if you are a long-term investor like us, and you stay in the game, the future is looking bright.
This information is taken from The Big Picture, to download a sample copy please just click here.
As always, if you have any questions or thoughts on the points covered in this post, please leave a comment below or connect with us @ISACO_ on Twitter.
About ISACO
ISACO is a specialist in ISA and SIPP Investment and the pioneer of ‘Shadow Investment’, a simple way to grow your ISA and SIPP. Together with our clients, we have £57 million actively invested in ISAs and pensions**.
Our personal investment service allows you to look over our shoulder and buy into exactly the same funds as we are buying. These are investment funds that we personally own and so you can be assured that they are good quality. We are proud to say that by ‘shadowing’ us, our clients have made an annual return of 12.5% per year over the last four years*** versus the FTSE 100’s 7.4%.
We currently have close to 400 carefully selected clients. Most of them have over £100,000 actively invested and the majority are DIY investors such as business owners, self-employed professionals and corporate executives. We also have clients from the financial services sector such as IFAs, wealth managers and fund managers. ISACO Ltd is authorised and regulated by the Financial Conduct Authority (FCA). Our firm reference number is 525147.
** 15th November 2012: Internal estimation of total ISA and pension assets owned by ISACO Investment Team and ISACO premium clients.
*** 31st December 2008 - 31st December 2012.
ISACO investment performance verified by Independent Executives Ltd.
To download our free report 'A Golden Opportunity' >>
To download our Shadow Investment brochure >>
To start your 14 day free 'no obligation' trial of Shadow Investment >>