It's a question we're often asked - are we in a bull market or a bear market? In this post, we'll examine the evidence in more detail.
This information is taken from The Big Picture, to download a sample copy please just click here.
The current bull market started in March 2009
Take a look at this five year chart of the NASDAQ Composite and you’ll see that even though we are currently in a retracement, the bull market that began in March 2009 (Point A) is almost five years old and for now remains intact.
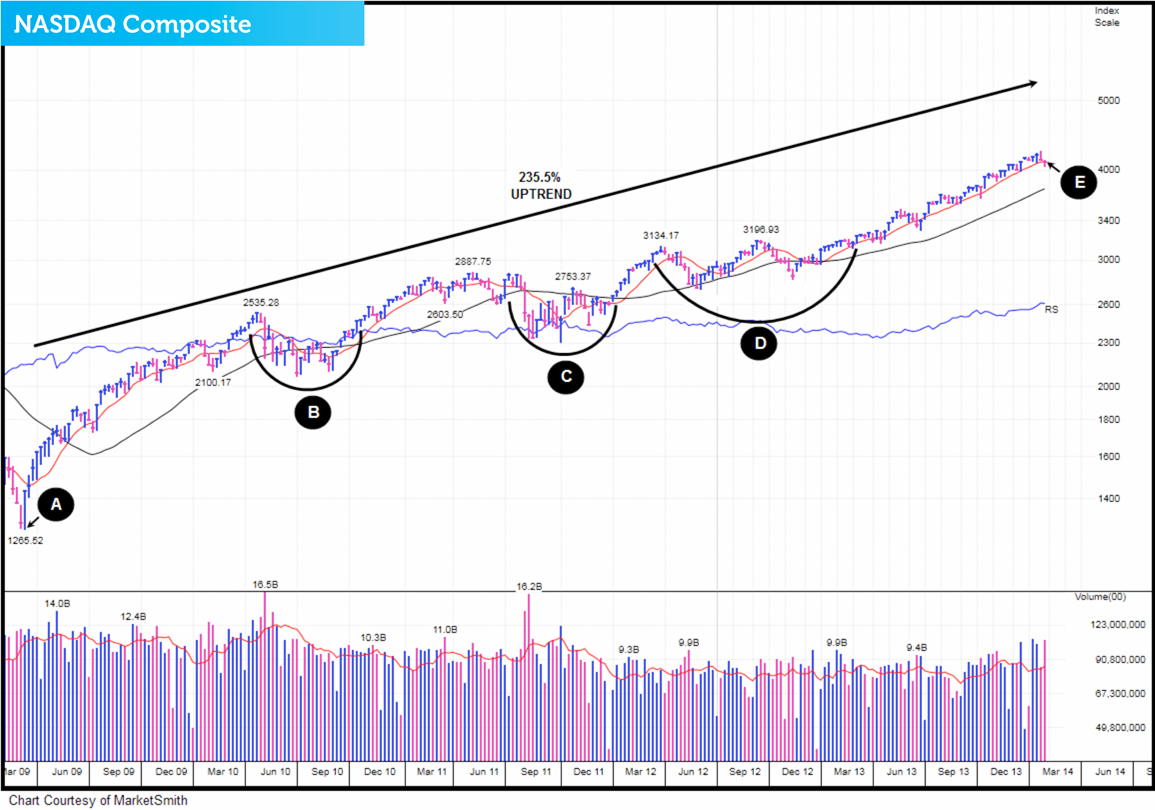
Since the uptrend began, the NASDAQ Composite has made a 235.5% return. However, to make that gain it has had to experience three challenging corrections. The first (Point B) occurred from April to November 2010. The second (Point C) is a correction that started in May 2011 and ended in January 2012. The third (Point D), began in late March 2012 and finished March 2013. Right now the market is experiencing another pullback which began 23rd January (Point E).
NASDAQ Composite: strong support at its 50-day moving average?
For the last twelve months, the NASDAQ has acted very well on and around its 50-day moving average. On seven occasions (Point F) it has found support on, just above or just below this key technical line.
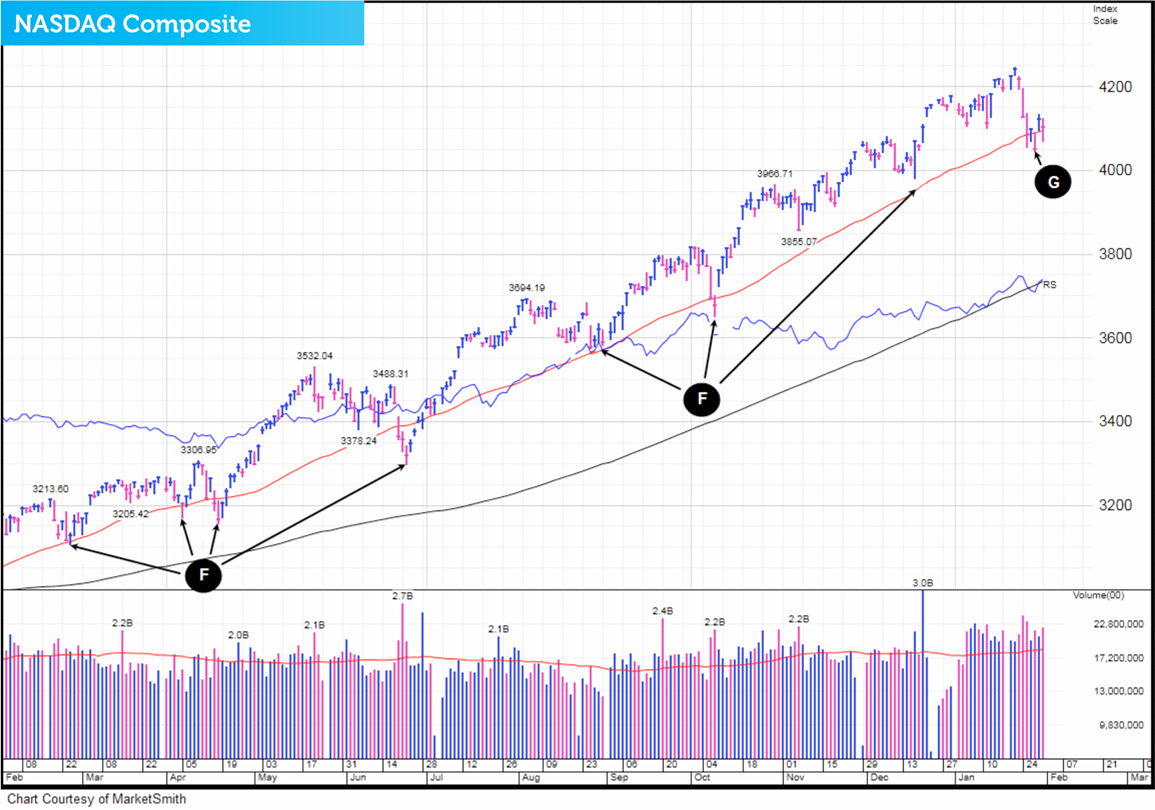
The big question is, has it recently found solid ground at this important indicator for an eighth time? On the 29th of January it fell below it (Point G) however on three of the last seven occasions (Point H) it also dropped below but quickly found its feet and rebounded strongly.
Where is the market likely to head next?
The NASDAQ Composite acted well on the 28th and 30th of January (Point I). This is known as institutional buying which is seen as constructive behaviour.
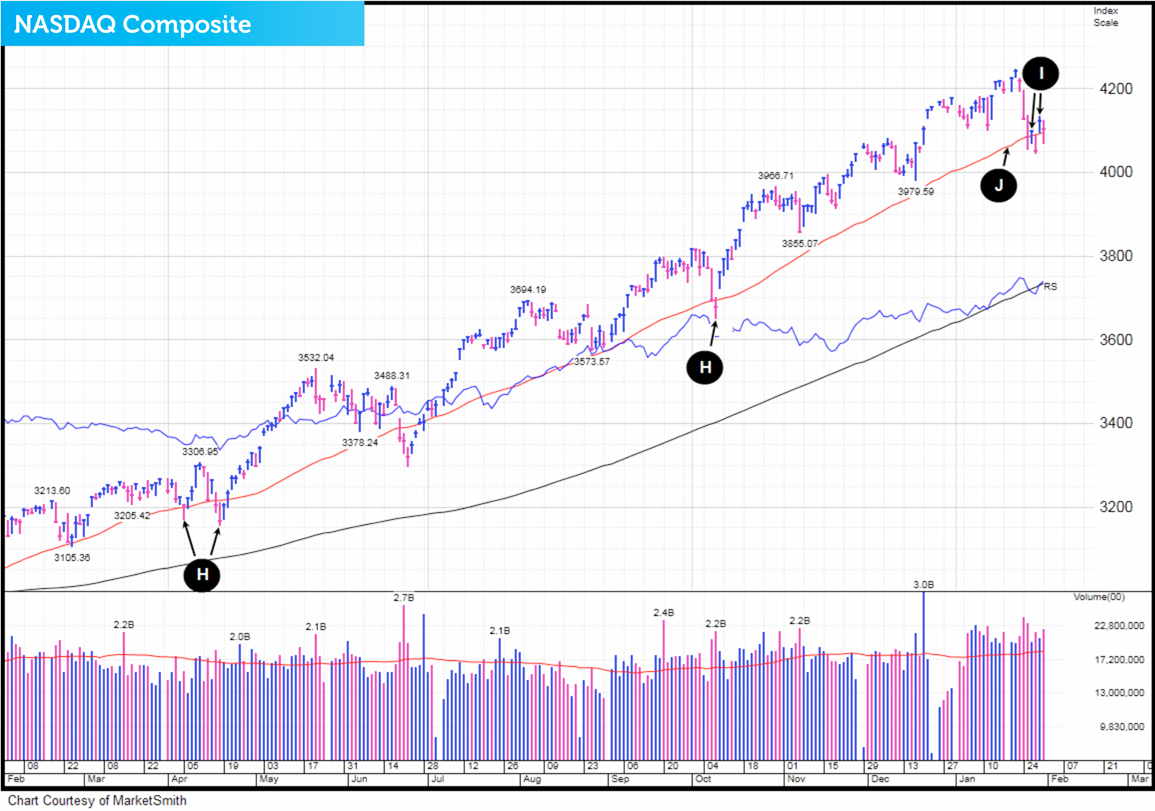
It was especially encouraging to see because the activity happened on and around the indexes 50 day moving average line (Point J).
Headwinds at 4200 on the NASDAQ
Take a look at this 20-year chart of the NASDAQ Composite and you can see that between July and September of the year 2000, the US technology index had trouble getting back above the 4200 price level (Point K).
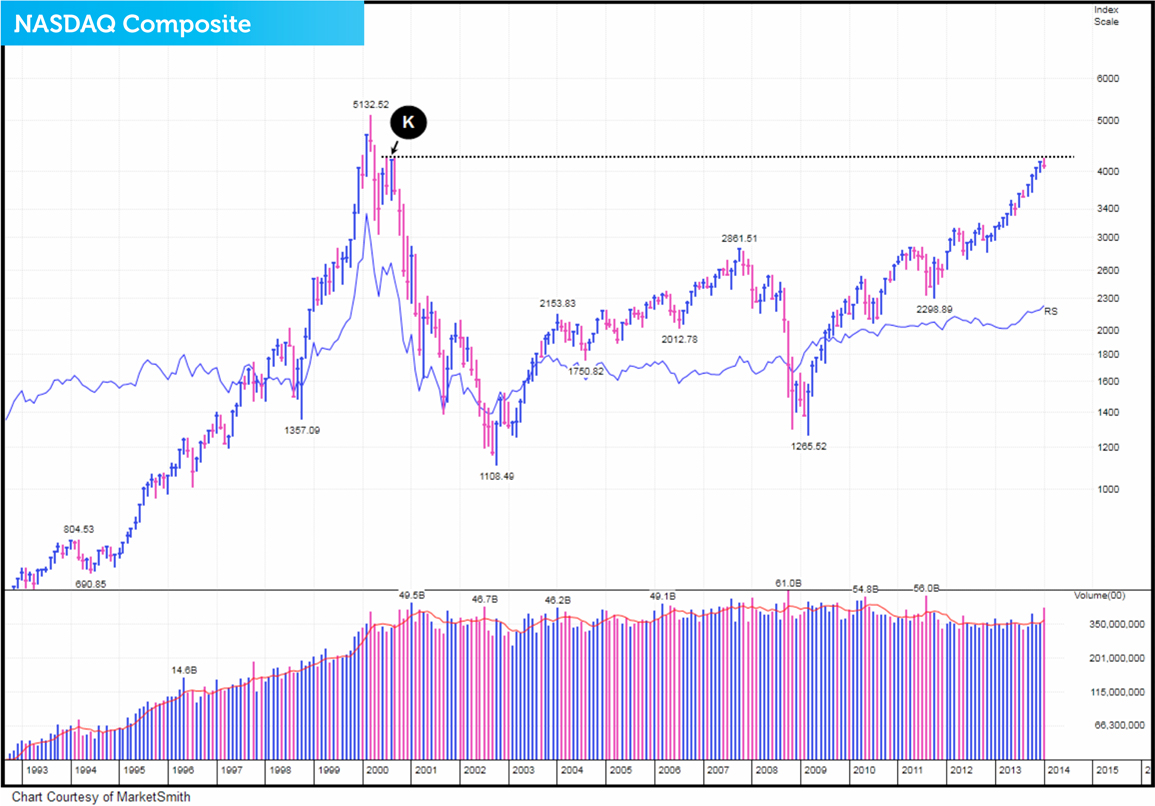
This was first pointed out in last month’s edition of The Big Picture. In January’s publication when talking about the NASDAQ, we brought your attention to the fact that the US technology index did have resistance at the 4200 level and said:
“We therefore think that it will probably come up against a headwind very soon.”
We don’t always get our market calls right but with this one, were we right?
Exceeding performance expectations
Our aim is to outperform the FTSE 100 and we are proud of our 23.1% 2013 return which some would say is impressive and even more so when compared to the FTSE 100’s 2013 return of 14.4%.

As you can see on this bar chart, we’ve also delivered solid returns over the last 5 years2 and managed to make an average annual gain of 14.5% versus the FTSE’s 8.8%. And if we go back even further, since beginning investing back in 19973, we’ve outperformed the FTSE 100 by 60.2% which means we’ve beaten the main UK stock index on average by 2.4% per year.
This information is taken from The Big Picture, to download a sample copy please just click here.
As always, if you have any questions or thoughts on the points covered in this post, please leave a comment below or connect with us @ISACO_ on Twitter.
About ISACO
ISACO specialises in ISA and SIPP Investment and is the pioneer of ‘Shadow Investment’; an easy way to grow your ISA and SIPP at low cost. Together with our clients, we have an estimated £57 million actively invested in ISAs and pensions*. Clients like us because we have a great track record of ‘beating’ the FTSE 100**. Over the last 16 years, we’ve outperformed the Footsie by 60.2% and over the last 5 years, we’ve averaged 14.5% each year versus the FTSE 100’s 8.8%. You can find us at www.ISACO.co.uk.
What is Shadow Investment?
Picking the right fund for your ISA and SIPP is not exactly the easiest job in the world. And knowing 'when' to buy and 'when' to exit is even more difficult! Our ‘Shadow Investment’ Service is here to help. Our service allows you to look over our shoulder and buy the same funds that we are buying.
When we are thinking of buying a fund, we alert you so that you have the opportunity to buy it on the same day that we buy it. We also tell you about when we are planning to exit the fund. You control your investment account, not us. You can start small and invest as little or as much money as you like.
By knowing what we are buying, when we are buying and when we are exiting, throughout the year you can mirror our movements and in effect replicate our trades. This means you have the opportunity to benefit from exactly the same investment returns that we get. Our investment aims are 10–12% per year.
We are totally independent, fully transparent and FCA compliant. We’re warm, friendly and highly responsive and it’s a very personal service that gives you direct access to the Sutherland brothers; ISACO’s two founders.
Who are ISACO’s clients?
Clients who benefit most from our service have over £250,000 actively invested and the majority of them are wealthy retirees, business owners, self-employed professionals and corporate executives. We also have clients from the financial services sector, such as IFAs and wealth managers.
Do you have questions?
To have all your questions answered, call 0800 170 7750 or email us at: info@ISACO.co.uk.
*November 15th 2012: Internal estimation of total ISA and pension assets owned by ISACO Investment Team and ISACO premium clients.
**Long-term performance: December 31st 1997 - December 31st 2013 ISACO 91.3%, FTSE 100 31.1%. 5 year performance: December 31st 2008 - December 31st 2013. ISACO Investment performance verified by Independent Executives Ltd.
To download our free report 'A Golden Opportunity' >>
To download our Shadow Investment brochure >>
To start your 14 day free 'no obligation' trial of Shadow Investment >>


