In this post we'll take a look at what has been happening in the market since the beginning of February.
This information is taken from The Big Picture, to download a sample copy please just click here.
To put this recent behaviour in context, take a look at this 20-year chart of the NASDAQ Composite and you’ll see that the bull market that began in March 2009 (Point A) is five years old and for now remains intact.
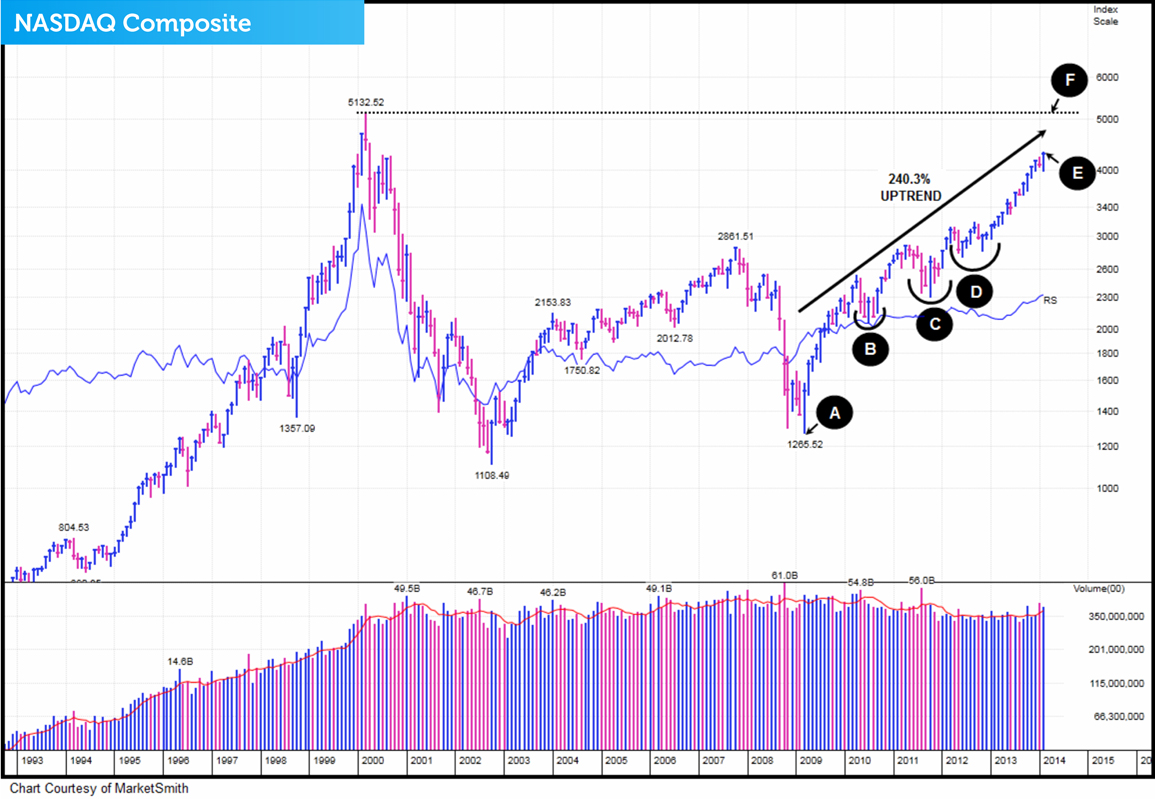
Since the uptrend began, the NASDAQ Composite has made a very impressive 240.3% return. However, to make that gain it has had to experience three challenging corrections. The first (Point B) occurred from April to November 2010. The second (Point C) is a correction that started in May 2011 and ended in January 2012. The third (Point D), began in late March 2012 and finished March 2013. Right now the market is trading close to its recent high (Point E) and rapidly closing in on the highs it made back in March 2000 (Point F).
Investors wave good bye to recent correction
The correction that began January 23rd (Point G) officially ended February 18th (Point H).
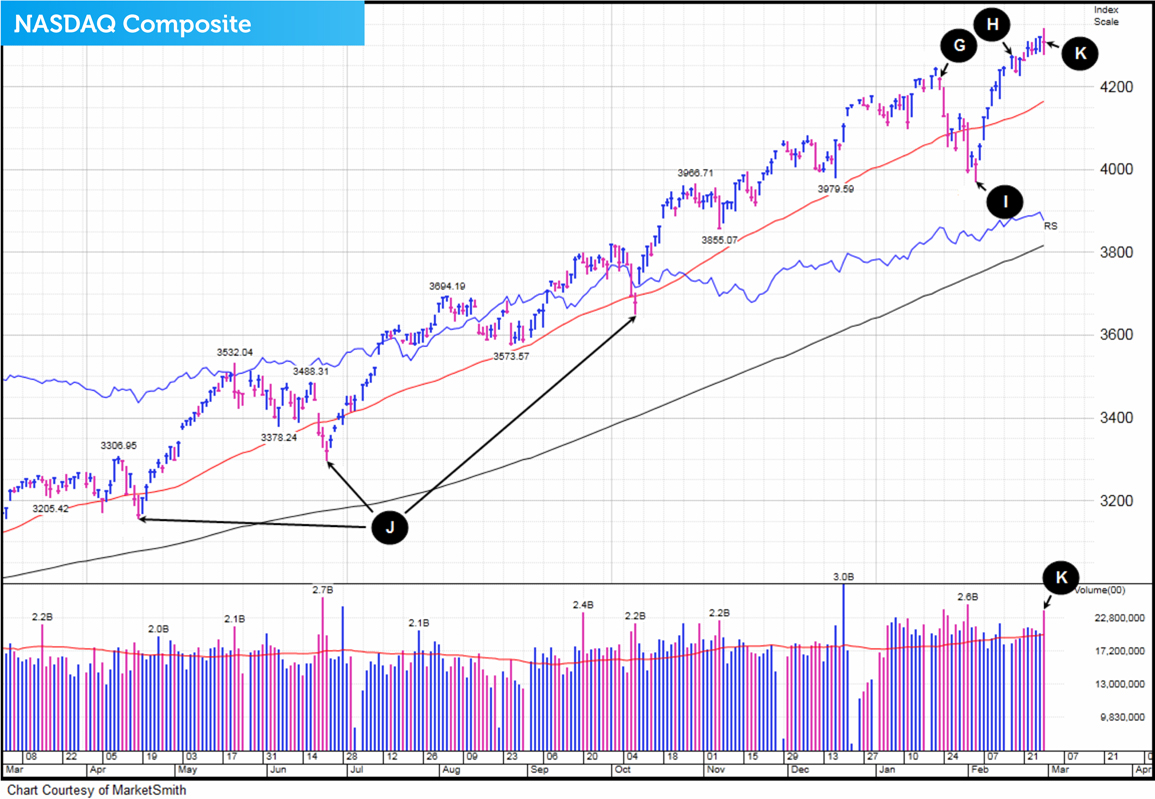
Notice that during February the US technology successfully found support once again just below its 50-day moving average (Point I). Because the NASDAQ has done this three times before in the last twelve months (Point J) it tells us that this leading index is still ‘in character’ and behaving extremely well.
Did we see churning on the last trading day of February?
On Friday 28th February, the NASDAQ experienced a day that looked like ‘churning’ (very heavy volume with little price progress) which sometimes indicates a temporary top (Point K).
Since the 28th of February the market has gained some ground however on Thursday 6th March, the NASDAQ experienced another possible ‘churning’ day.
Our thoughts for the year of 2014
Even though the market is back trading close to its recent highs, the indexes and our portfolio are due a rest. That does not necessarily mean the market and our funds can’t go higher from here however at some point we will experience a fairly substantial correction. Some clients say, if you are expecting the market to pullback this year, why not move into cash? The reason is timing the market in the short term is virtually impossible. Also during bull markets (like we are in right now) smart investors sit tight and remain fully invested. And as I’m sure you are aware, our rule is to never exit a bull market even when we believe a correction is imminent. We only exit when we believe the bull market has finally run its course.
Volatility in the short term but the long-term future is looking bright
At some point in the future unknown to us, the market and our portfolio will have a decent sized correction. When the market does pull back, even though investment account values will take a temporary dip, we like correction periods because it helps remove the excess that gets built up. A fairly large retracement at some stage this year would be positive in our opinion because it would help flush out all the weak hands and assist the indexes in resetting. One thing to expect this year is increased volatility. Beyond 2014, we believe we’ll continue to experience solid performance from the equity markets and this means that if you are a long-term investor like us, and have the stomach to stay in the game, the future is looking bright.
Exceeding performance expectations
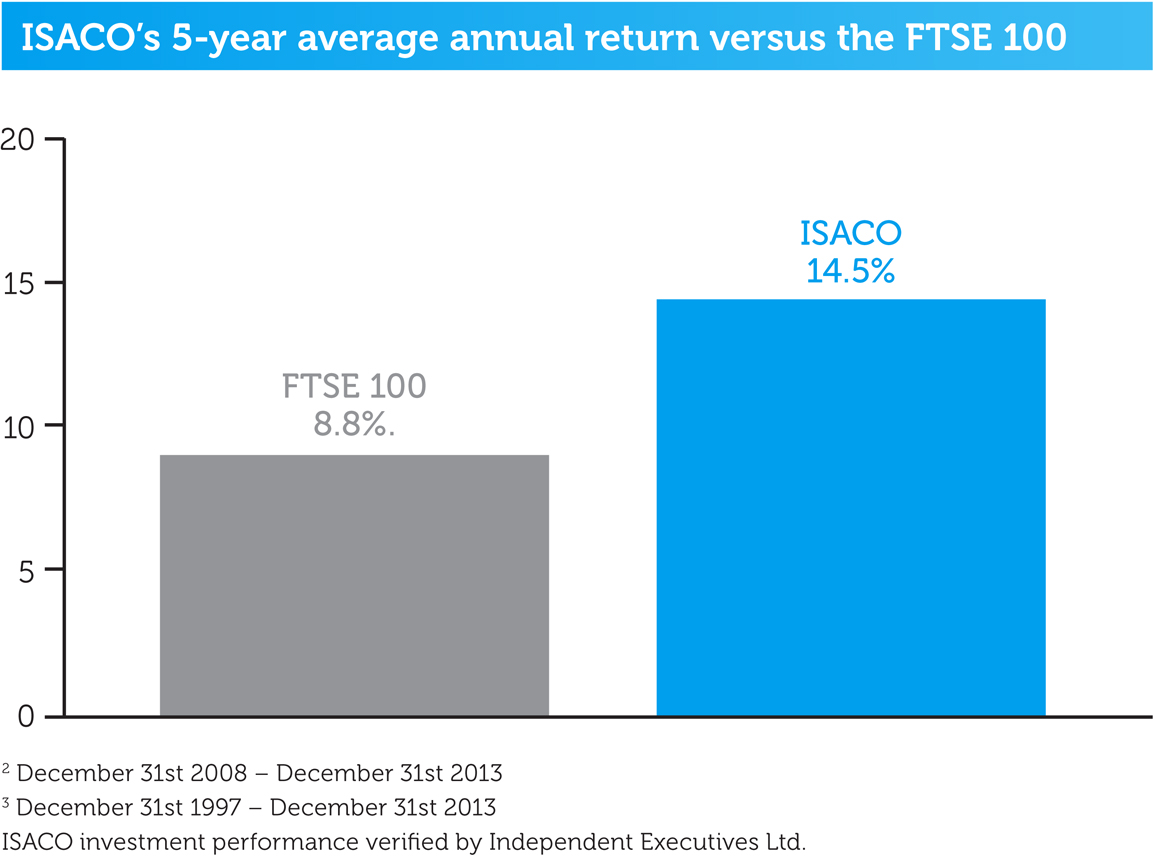
Our aim is to outperform the FTSE 100 and we are proud of our 23.1%** 2013 return which some would say is impressive and even more so when compared to the FTSE 100’s 2013 return of 14.4%. As you can see on this bar chart, we’ve also delivered solid returns over the last 5 years and managed to make an average annual gain of 14.5% versus the FTSE’s 8.8%.
Long-term performance
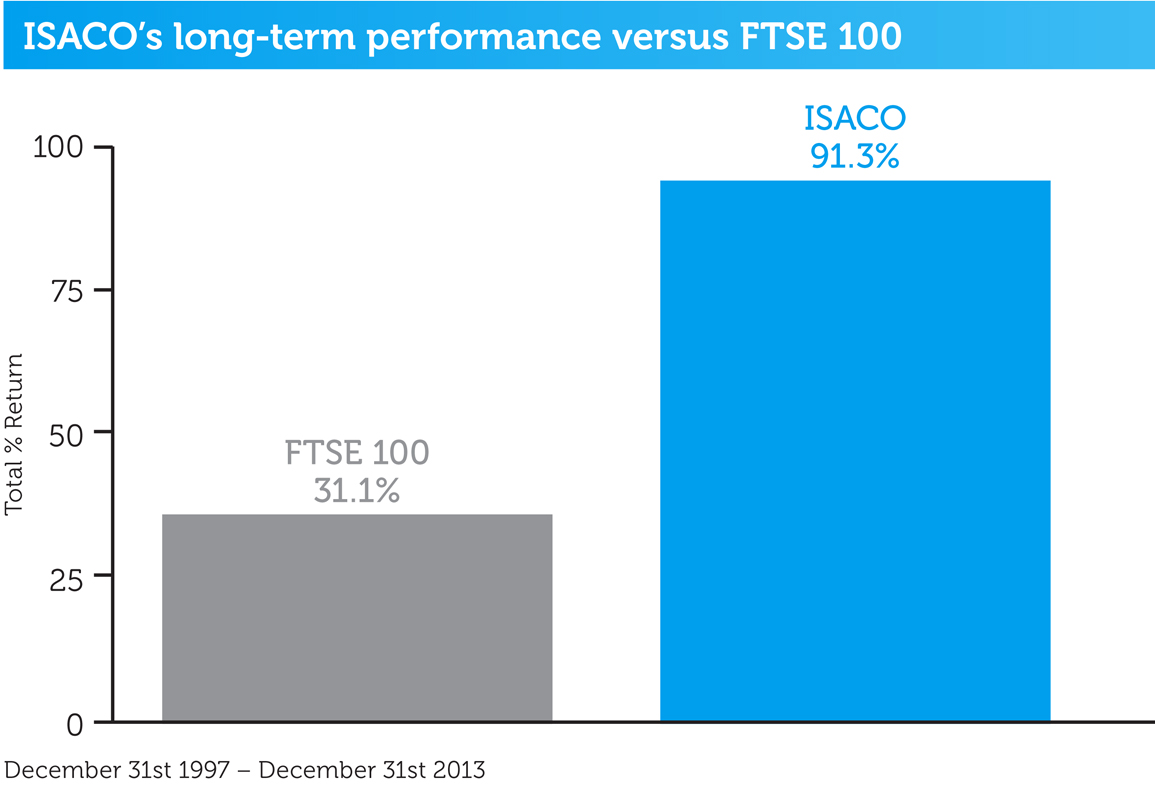
If we go back even further, since beginning investing back in 1997, we’ve outperformed the FTSE 100 by 60.2% which means we’ve beaten the main UK stock index on average by 2.4% per year**.
This information is taken from The Big Picture, to download a sample copy please just click here.
As always, if you have any questions or thoughts on the points covered in this post, please leave a comment below or connect with us @ISACO_ on Twitter.
About ISACO
ISACO specialises in ISA and SIPP Investment and is the pioneer of ‘Shadow Investment’; an easy way to grow your ISA and SIPP at low cost. Together with our clients, we have an estimated £57 million actively invested in ISAs and pensions*. Clients like us because we have a great track record of ‘beating’ the FTSE 100**. Over the last 16 years, we’ve outperformed the Footsie by 60.2% and over the last 5 years, we’ve averaged 14.5% each year versus the FTSE 100’s 8.8%. You can find us at www.ISACO.co.uk.
What is Shadow Investment?
Picking the right fund for your ISA and SIPP is not exactly the easiest job in the world. And knowing 'when' to buy and 'when' to exit is even more difficult! Our ‘Shadow Investment’ Service is here to help. Our service allows you to look over our shoulder and buy the same funds that we are buying.
When we are thinking of buying a fund, we alert you so that you have the opportunity to buy it on the same day that we buy it. We also tell you about when we are planning to exit the fund. You control your investment account, not us. You can start small and invest as little or as much money as you like.
By knowing what we are buying, when we are buying and when we are exiting, throughout the year you can mirror our movements and in effect replicate our trades. This means you have the opportunity to benefit from exactly the same investment returns that we get. Our investment aims are 10–12% per year.
We are totally independent, fully transparent and FCA compliant. We’re warm, friendly and highly responsive and it’s a very personal service that gives you direct access to the Sutherland brothers; ISACO’s two founders.
Who are ISACO’s clients?
Clients who benefit most from our service have over £250,000 actively invested and the majority of them are wealthy retirees, business owners, self-employed professionals and corporate executives. We also have clients from the financial services sector, such as IFAs and wealth managers.
Do you have questions?
To have all your questions answered, call 0800 170 7750 or email us at: info@ISACO.co.uk.
*November 15th 2012: Internal estimation of total ISA and pension assets owned by ISACO Investment Team and ISACO premium clients.
**Long-term performance: December 31st 1997 - December 31st 2013 ISACO 91.3%, FTSE 100 31.1%. 5 year performance: December 31st 2008 - December 31st 2013. ISACO Investment performance verified by Independent Executives Ltd.
To download our free report 'A Golden Opportunity' >>
To download our Shadow Investment brochure >>
To start your 14 day free 'no obligation' trial of Shadow Investment >>


