In this post we'll take a look at what has been happening in the market since the beginning of March.
This information is taken from The Big Picture, to download a sample copy please just click here.
To put this recent behaviour in context, take a look at this 20-year chart of the NASDAQ Composite and you’ll see that the bull market that began in March 2009 (Point A) is five years old and for now remains intact.
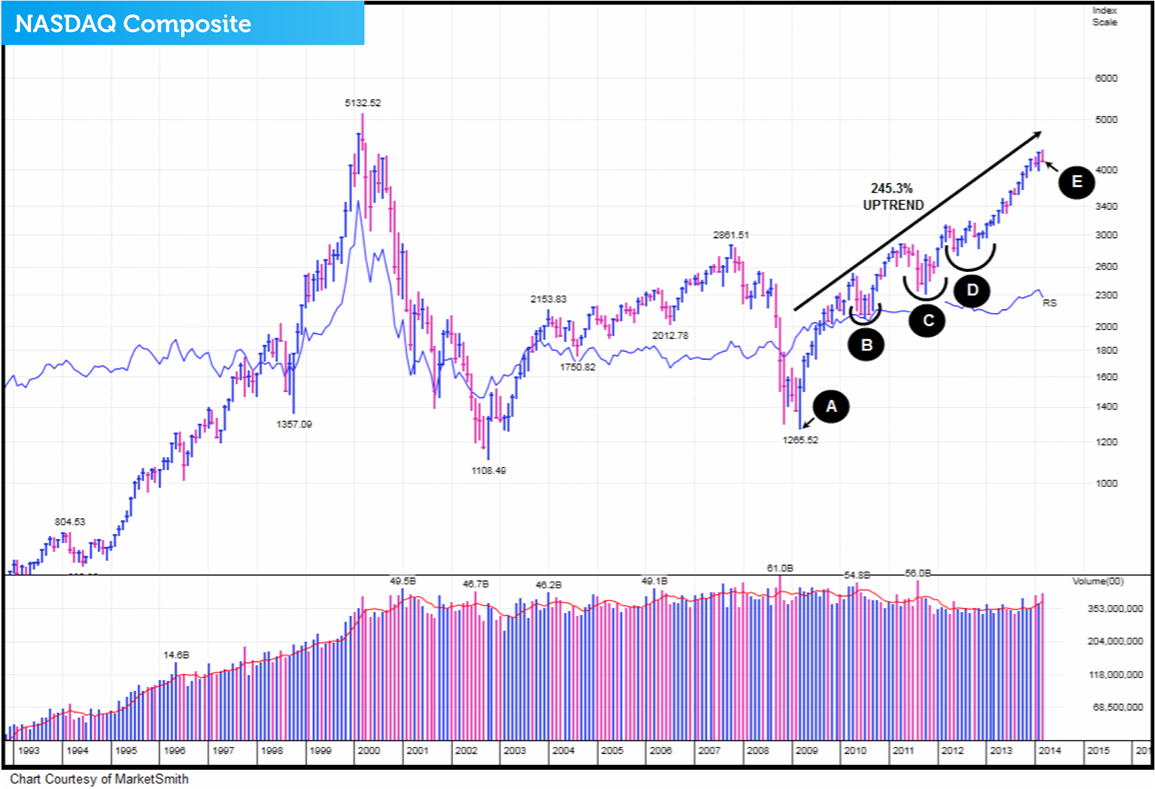
Since the uptrend began, the NASDAQ Composite has made a very impressive 245.3% return. However, to make that gain it has had to experience three challenging corrections. The first (Point B) occurred from April to November 2010. The second (Point C) is a correction that started in May 2011 and ended in January 2012. The third (Point D), began in late March 2012 and finished March 2013. Right now the market is experiencing another correction which for now remains fairly tame (Point E).
NASDAQ pulls back
When we switch to a daily chart, we can look at this present correction in more detail. The first signs that we were heading into a pullback came from behaviour known as ‘churning’ (heavy volume with little price progress). The first day of churning came on the 28th of February (Point F) and the second on the 6th of March (Point G).
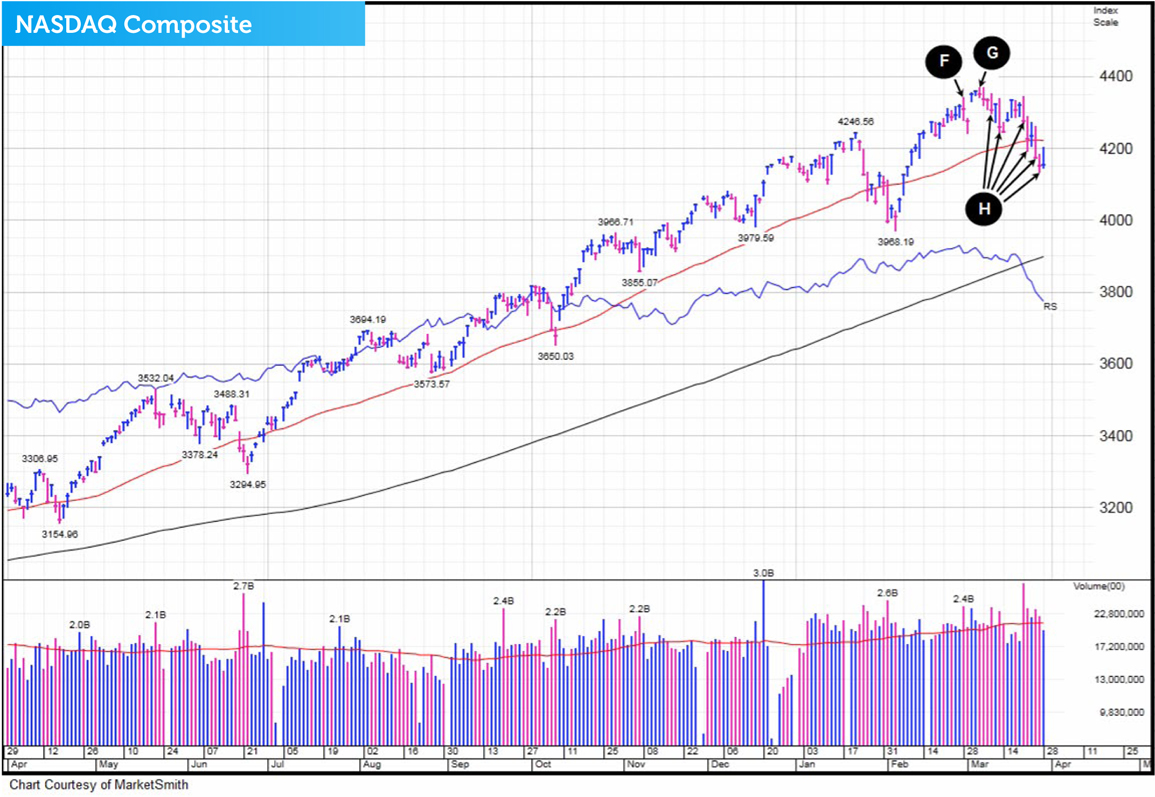
We then had six days of intense institutional selling in March (Point H) occurring March 11th, 13th, 21st, 24th, 26th and 27th. When you see churning behaviour and as many as six days of professional selling over a three-week period, it often indicates a market top. The good news was that leading stocks were not breaking down. When the indexes are falling and the markets best stocks are not imploding, it tells us that the retracement will most probably be a less severe bull market correction rather than a deep long and nasty bear market.
NASDAQ dips below 50-day moving average
On Friday 28th March we saw the NASDAQ trading below its 50-day moving average (Point I). Over the last twelve months, the longest it has spent below this key line before aggressively bouncing back was five days (Point J).
During the other three times it fell below this important technical line, the US technology index spent beneath it between one and four days. This type of recurring behaviour is what we call a market keeping with its character and is exactly what we like to see.
The NASDAQ so far in April
In keeping with its character, after spending just four days below its 50-day moving average, the US technology index powered through it on the 1st April (Point C).
However, since then it has fallen 2.6% on Friday March 4th and continued its slide falling a further 1.16% in above average volume on Monday March 7th. The drop was once again made in extremely heavy trade which tells us that institutional investors were dumping equities.
The NASDAQ confirmed for a second day running that its recent character has changed. However, even though the NASDAQ is currently in a 6.7% correction, our portfolio is showing a net gain of 1.1% for the year. What does that tell us? It says that the stocks our funds own are outperforming or ‘beating’ the market. This is a good sign and a clue to say that this correction is probably nothing to concern ourselves with.
However we do think that the NASDAQ may drop down further and test its 200-day moving average and even the 3500 level. But we also believe that this current retracement is yet another healthy bull market correction and not a more severe bear market correction.
This information is taken from The Big Picture, to download a sample copy please just click here.
As always, if you have any questions or thoughts on the points covered in this post, please leave a comment below or connect with us @ISACO_ on Twitter.
About ISACO
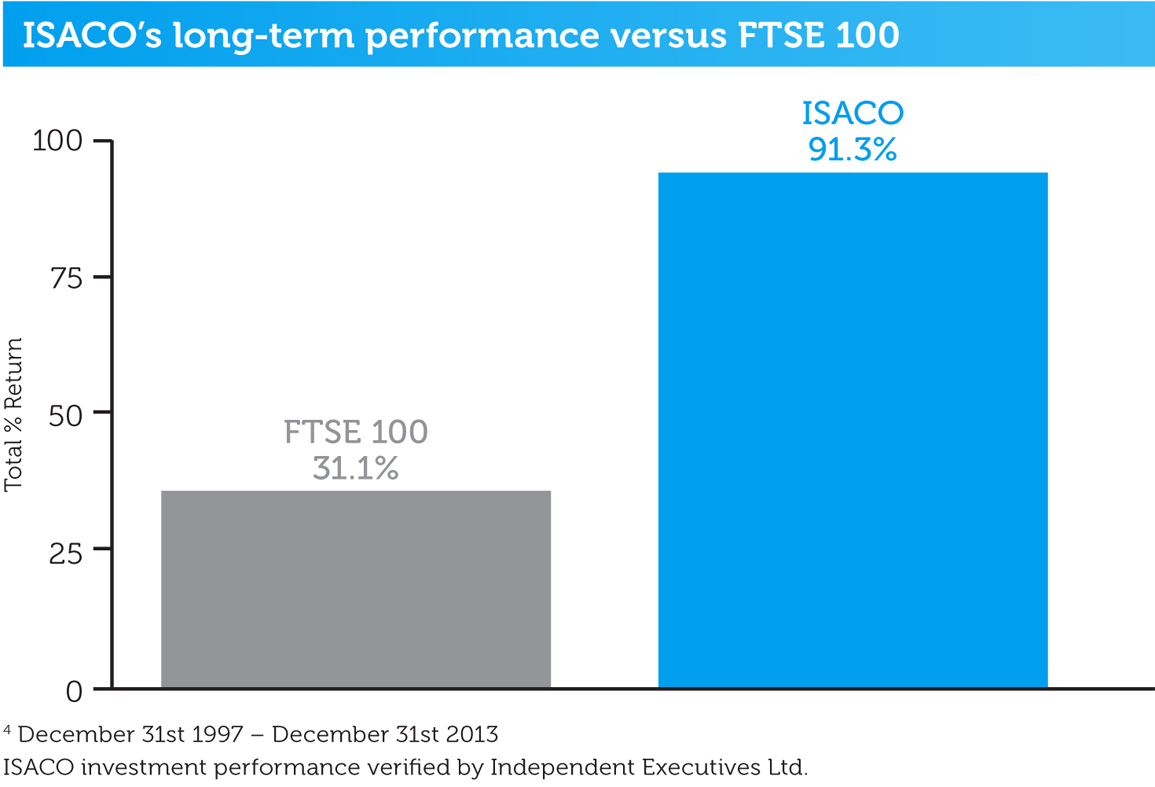
ISACO specialises in ISA and SIPP Investment and is the pioneer of ‘Shadow Investment’; an easy way to grow your ISA and SIPP at low cost. Together with our clients, we have an estimated £57 million actively invested in ISAs and pensions*. Clients like us because we have a great track record of ‘beating’ the FTSE 100**. Over the last 16 years, we’ve outperformed the Footsie by 60.2% and over the last 5 years, we’ve averaged 14.5% each year versus the FTSE 100’s 8.8%. You can find us at www.ISACO.co.uk.
What is Shadow Investment?
Picking the right fund for your ISA and SIPP is not exactly the easiest job in the world. And knowing 'when' to buy and 'when' to exit is even more difficult! Our ‘Shadow Investment’ Service is here to help. Our service allows you to look over our shoulder and buy the same funds that we are buying.
When we are thinking of buying a fund, we alert you so that you have the opportunity to buy it on the same day that we buy it. We also tell you about when we are planning to exit the fund. You control your investment account, not us. You can start small and invest as little or as much money as you like.
By knowing what we are buying, when we are buying and when we are exiting, throughout the year you can mirror our movements and in effect replicate our trades. This means you have the opportunity to benefit from exactly the same investment returns that we get. Our investment aims are 10–12% per year.
We are totally independent, fully transparent and FCA compliant. We’re warm, friendly and highly responsive and it’s a very personal service that gives you direct access to the Sutherland brothers; ISACO’s two founders.
Who are ISACO’s clients?
Clients who benefit most from our service have over £250,000 actively invested and the majority of them are wealthy retirees, business owners, self-employed professionals and corporate executives. We also have clients from the financial services sector, such as IFAs and wealth managers.
Do you have questions?
To have all your questions answered, call 0800 170 7750 or email us at: info@ISACO.co.uk.
*November 15th 2012: Internal estimation of total ISA and pension assets owned by ISACO Investment Team and ISACO premium clients.
**Long-term performance: December 31st 1997 - December 31st 2013 ISACO 91.3%, FTSE 100 31.1%. 5 year performance: December 31st 2008 - December 31st 2013. ISACO Investment performance verified by Independent Executives Ltd.
To download our free report 'A Golden Opportunity' >>
To download our Shadow Investment brochure >>
To start your 14 day free 'no obligation' trial of Shadow Investment >>


