In this post we'll take a look at what has been happening in the market since early April.
This information is taken from The Big Picture, to download a sample copy please just click here.
The way we use to check if the market is behaving as it should is to look at the trading action (price and volume activity) of institutional investors. Why do we do this? The stock market is about six month forward looking and its daily activity is the consensus conclusion whether institutional investors like or don’t like what they see happening down the road. By watching what the big players are doing (buying or selling) each and every day, it can provide essential clues to which way the market is likely to head.
It’s best to try to get ‘in sync’
Institutional investors control approximately 75% of the market’s future direction, which is why we aim to keep ‘in sync’ with them. If you don’t, it feels like trying to swim against a strong current. When you don’t get in sync, you often get hurt financially and that’s why we like to see if the 800-pound gorilla investors are buying, because when they do, it strengthens the market. However, if they are selling, it weakens it. The other thing we like to keep a close eye on is the behaviour of leading stocks.
If the market's best stocks are acting weaker than the general averages, it’s negative. However when leading stocks are outperforming the market, it’s positive. When leading equities are underperforming, the market is more likely to head lower, and if the market's premier stocks are outperforming, the market is likely to head higher. The good news is that top stocks continue to act well.
Bull market? Bear market? Where are we?
Take a look at this 20-year chart of the NASDAQ Composite and you’ll see that the bull market that began in March 2009 (Point A) is five years old and for now remains intact.
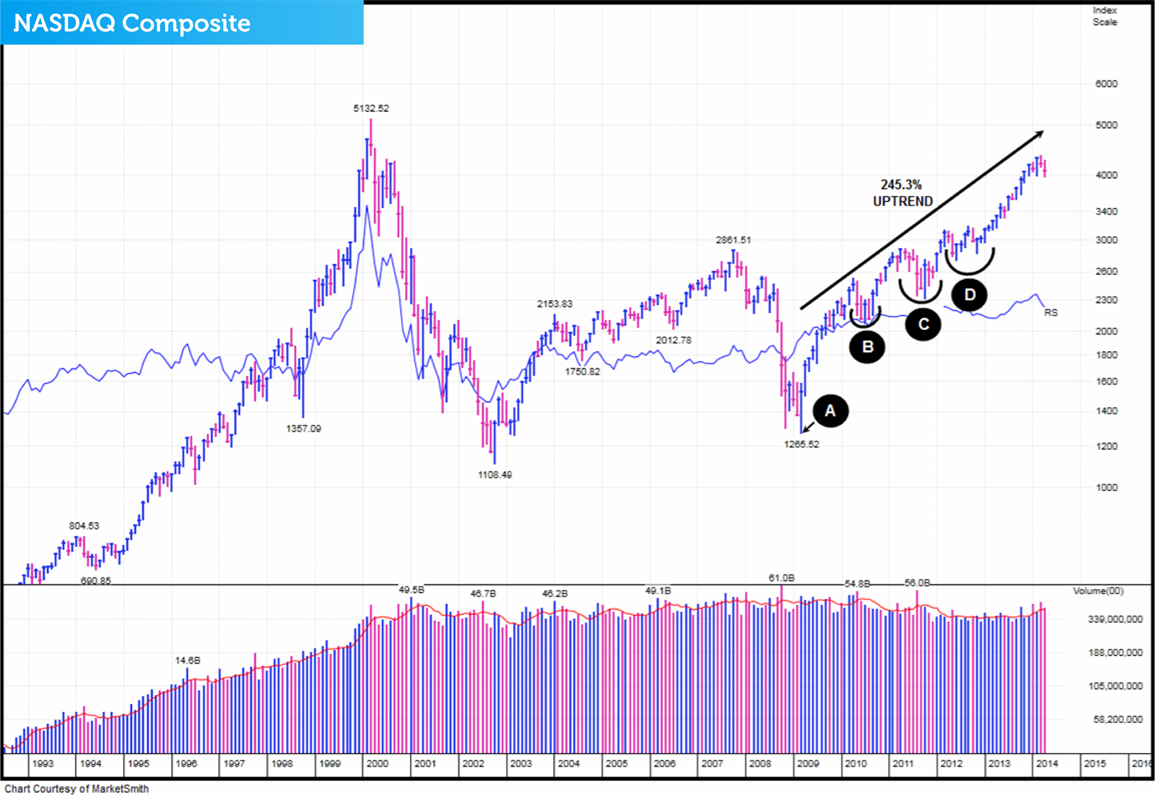
Since the uptrend began, the NASDAQ Composite has made a very impressive 245.3% return. However, to make that gain it has had to experience three challenging corrections. The first (Point B) occurred from April to November 2010. The second (Point C) is a correction that started in May 2011 and ended in January 2012. The third (Point D), began in late March 2012 and finished March 2013. Right now the market is experiencing another correction which for now remains fairly tame.
NASDAQ remains in a correction
When we switch to a daily chart, we can look at this present correction in more detail. The first signs that we were heading into a pullback came from behaviour known as ‘churning’ (heavy volume with little price progress). The first day of churning came on the 28th of February (Point E) and the second on the 6th of March (Point F).
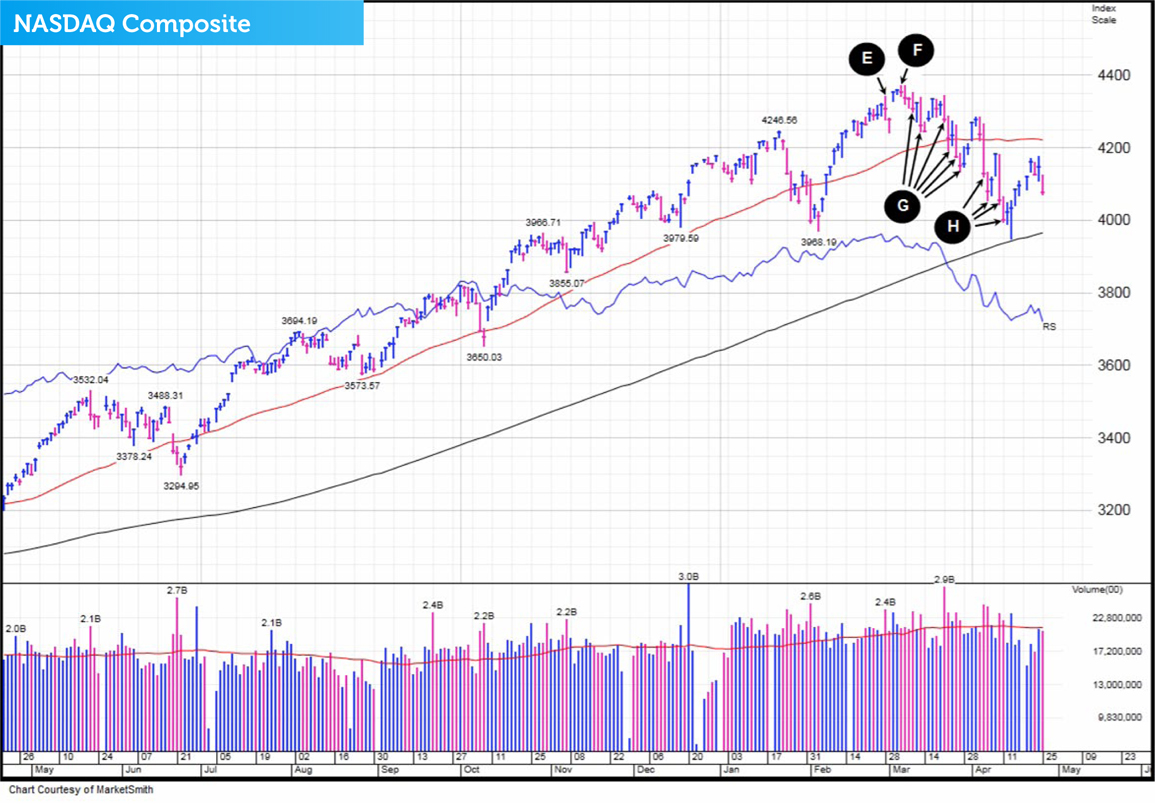
Following this, the NASDAQ experienced six days of institutional selling during the month of March (Point G) occurring on the 11th, 13th, 21st, 24th, 26th and 27th. As we moved into April, the US technology index was hit by four more days of institutional selling occurring on the 4th, 7th, 10th and 11th (Point H).
Support at 200-day ma but resistance at 50 day ma
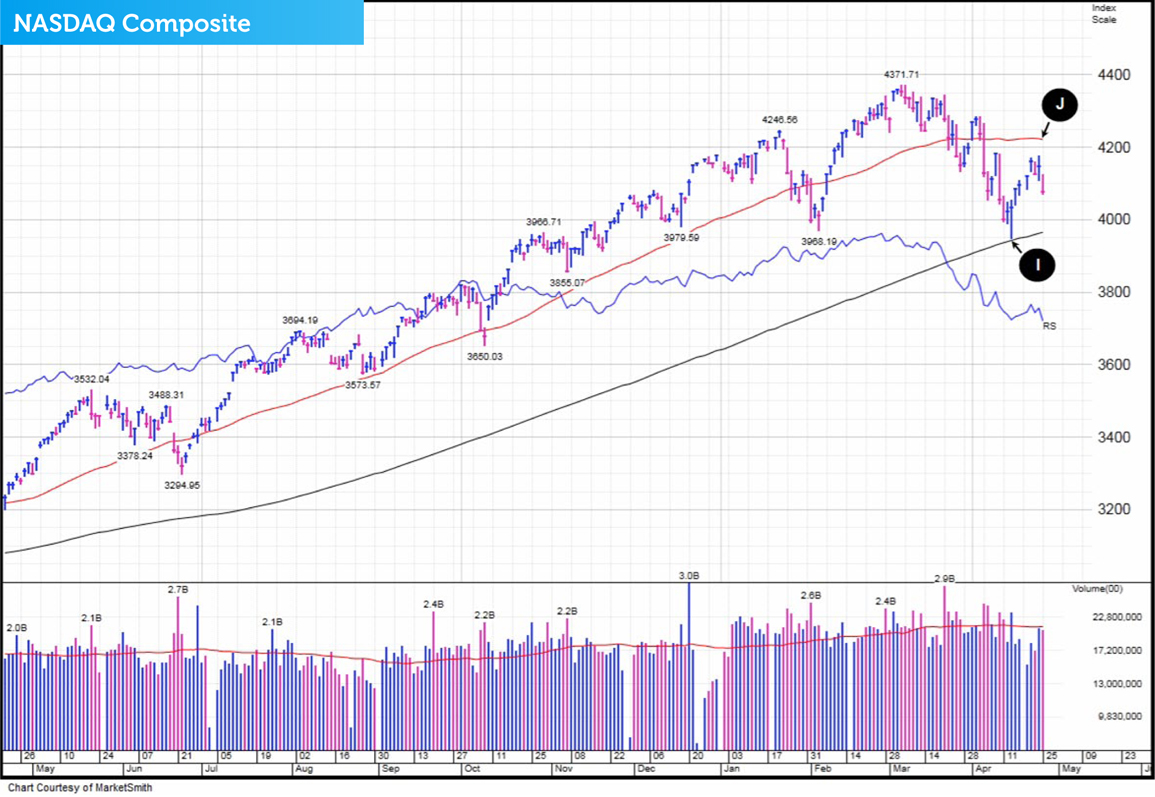
The good news is that recently the NASDAQ did manage to find some institutional support right on its 200-day moving average (Point I). It also recently managed to string together a series of six up days in row before hitting a ceiling as it approached its all important 50-day moving average (Point J).
Has the correction bottomed out?
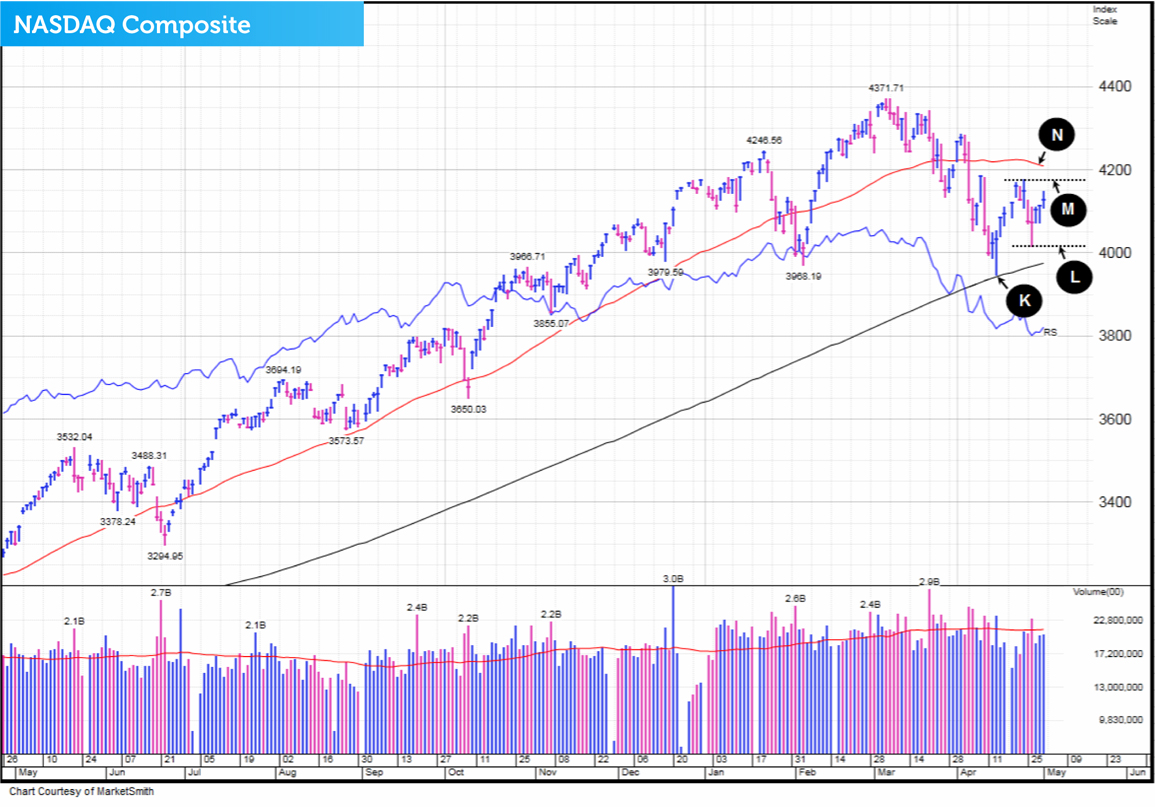
When analysing the NASDAQ on Friday 2nd May, in the Daily Market Update we pointed out that the uptick it made Thursday 1st May meant that it had had ten gains in the last thirteen sessions. Many technical investors would argue that ten out of thirteen probably means a new uptrend has begun. That would mean the 3946 low the US technology index made 15th April (Point K) will turn out to be the bottom of this latest correction.
That could be true and it may be setting up for a breakout move to the upside, but at the moment the NASDAQ is trading in a price range between 4014 (Point L) and 4177 (Point M). That means if we are in a new uptrend, and the market has found a bottom, the NASDAQ is going to have to get back above resistance at 4177 which may for now be a tough call, especially with the 50-day moving average being just above it (Point N).
This information is taken from The Big Picture, to download a sample copy please just click here.
As always, if you have any questions or thoughts on the points covered in this post, please leave a comment below or connect with us @ISACO_ on Twitter.
About ISACO
ISACO specialises in ISA and SIPP Investment and is the pioneer of ‘Shadow Investment’; an easy way to grow your ISA and SIPP at low cost. Together with our clients, we have an estimated £57 million actively invested in ISAs and pensions*. Clients like us because we have a great track record of ‘beating’ the FTSE 100**. Over the last 16 years, we’ve outperformed the Footsie by 60.2% and over the last 5 years, we’ve averaged 14.5% each year versus the FTSE 100’s 8.8%. You can find us at www.ISACO.co.uk.
What is Shadow Investment?
Picking the right fund for your ISA and SIPP is not exactly the easiest job in the world. And knowing 'when' to buy and 'when' to exit is even more difficult! Our ‘Shadow Investment’ Service is here to help. Our service allows you to look over our shoulder and buy the same funds that we are buying.
When we are thinking of buying a fund, we alert you so that you have the opportunity to buy it on the same day that we buy it. We also tell you about when we are planning to exit the fund. You control your investment account, not us. You can start small and invest as little or as much money as you like.
By knowing what we are buying, when we are buying and when we are exiting, throughout the year you can mirror our movements and in effect replicate our trades. This means you have the opportunity to benefit from exactly the same investment returns that we get. Our investment aims are 10–12% per year.
We are totally independent, fully transparent and FCA compliant. We’re warm, friendly and highly responsive and it’s a very personal service that gives you direct access to the Sutherland brothers; ISACO’s two founders.
Who are ISACO’s clients?
Clients who benefit most from our service have over £250,000 actively invested and the majority of them are wealthy retirees, business owners, self-employed professionals and corporate executives. We also have clients from the financial services sector, such as IFAs and wealth managers.
Do you have questions?
To have all your questions answered, call 0800 170 7750 or email us at: info@ISACO.co.uk.
*November 15th 2012: Internal estimation of total ISA and pension assets owned by ISACO Investment Team and ISACO premium clients.
**Long-term performance: December 31st 1997 - December 31st 2013 ISACO 91.3%, FTSE 100 31.1%. 5 year performance: December 31st 2008 - December 31st 2013. ISACO Investment performance verified by Independent Executives Ltd.
> " target="_self"> To download our free report 'A Golden Opportunity' >>
>" target="_self"> To download our Shadow Investment brochure >>
> " target="_self"> To start your 14 day free 'no obligation' trial of Shadow Investment >>


