In this post we'll take a look at what has been happening in the market since early May.
This information is taken from The Big Picture, to download a sample copy please just click here.
The way we use to check if the market is behaving as it should is to look at the trading action (price and volume activity) of institutional investors. Why do we do this? The stock market is about six month forward looking and its daily activity is the consensus conclusion whether institutional investors like or don’t like what they see happening down the road. By watching what the big players are doing (buying or selling) each and every day, it can provide essential clues to which way the market is likely to head.
It’s best to try to get ‘in sync’
Institutional investors control approximately 75% of the market’s future direction, which is why we aim to keep ‘in sync’ with them. If you don’t, it feels like trying to swim against a strong current. When you don’t get in sync, you often get hurt financially and that’s why we like to see if the 800-pound gorilla investors are buying, because when they do, it strengthens the market. However, if they are selling, it weakens it. The other thing we like to keep a close eye on is the behaviour of leading stocks.
If the market's best stocks are acting weaker than the general averages, it’s negative. However when leading stocks are outperforming the market, it’s positive. When leading equities are underperforming, the market is more likely to head lower, and if the market's premier stocks are outperforming, the market is likely to head higher.
Bull market? Bear market? Where are we?
Take a look at this 20-year chart of the NASDAQ Composite and you’ll see that the bull market that began in March 2009 (Point A) is five years old and for now remains intact.
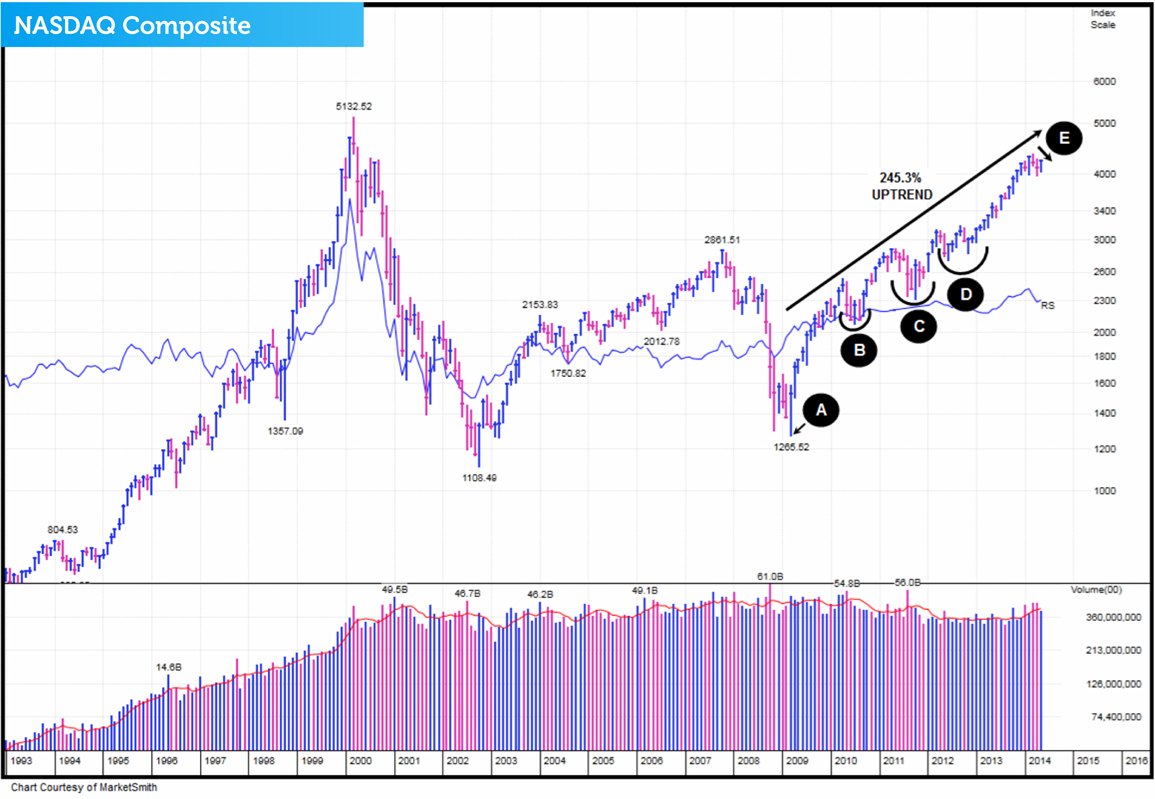
Since the uptrend began, the NASDAQ Composite has made a very impressive 245.3% return. However, to make that gain it has had to experience three challenging corrections. The first (Point B) occurred from April to November 2010. The second (Point C) is a correction that started in May 2011 and ended in January 2012. The third (Point D), began in late March 2012 and finished March 2013. Right now the market is experiencing another correction (Point E).
May ends with mixed messages
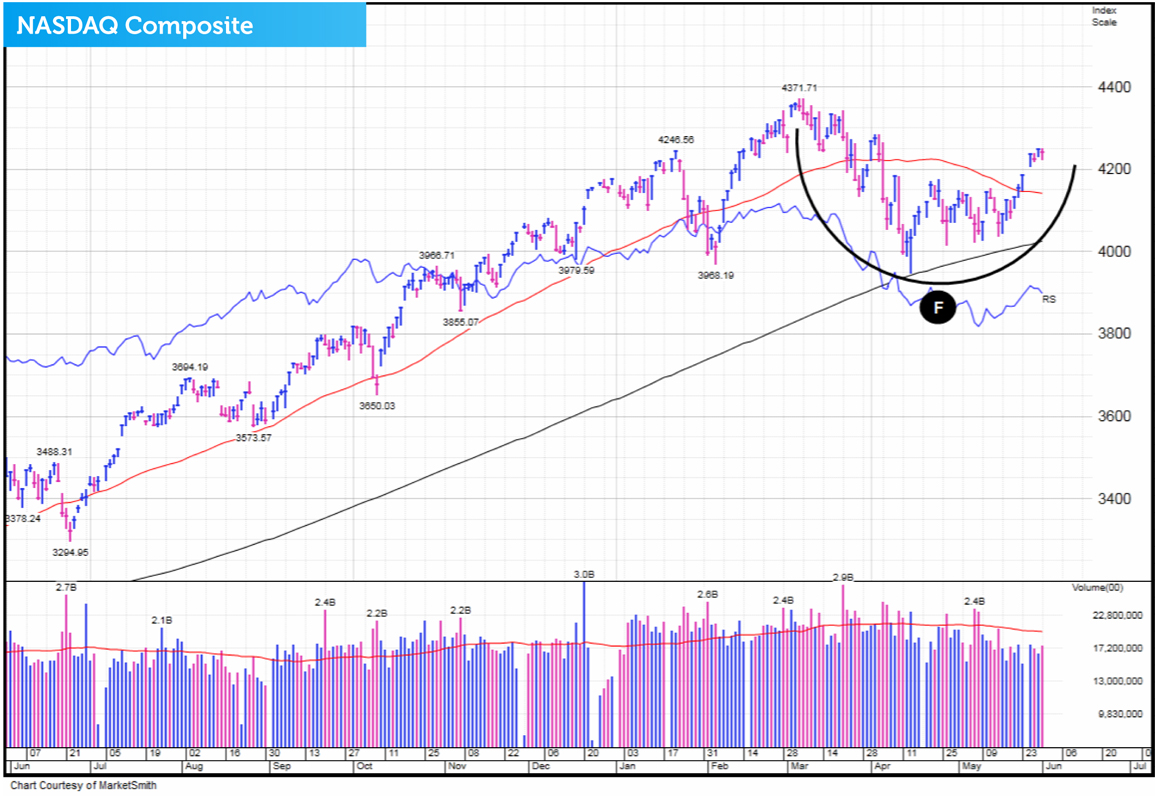
The month of May closed out with the market bombarding investors with a multitude of mixed messages. On the plus side the NASDAQ Composite (Point F), the NASDAQ 100 and the S&P 400 have all been busy carving out bullish cup formations. We also know that there is currently plenty of strength in the chip sector, what many refer to as the heart and soul of the NASDAQ.
NASDAQ day 29 ‘weak and late’ follow through
On Tuesday 27th May 2014, the NASDAQ Composite followed through on day 29 (Point G) of a rally that began 15th April 2014 (Point H). Unfortunately not all the boxes were ticked to make the follow through confirmed. Firstly the price gain for the day was 1.2% where ideally we like to see a rise of 1.7% or higher. We also like to see follow throughs occur between days four and seven of a new rally and so this one happening on day 29 came very late.
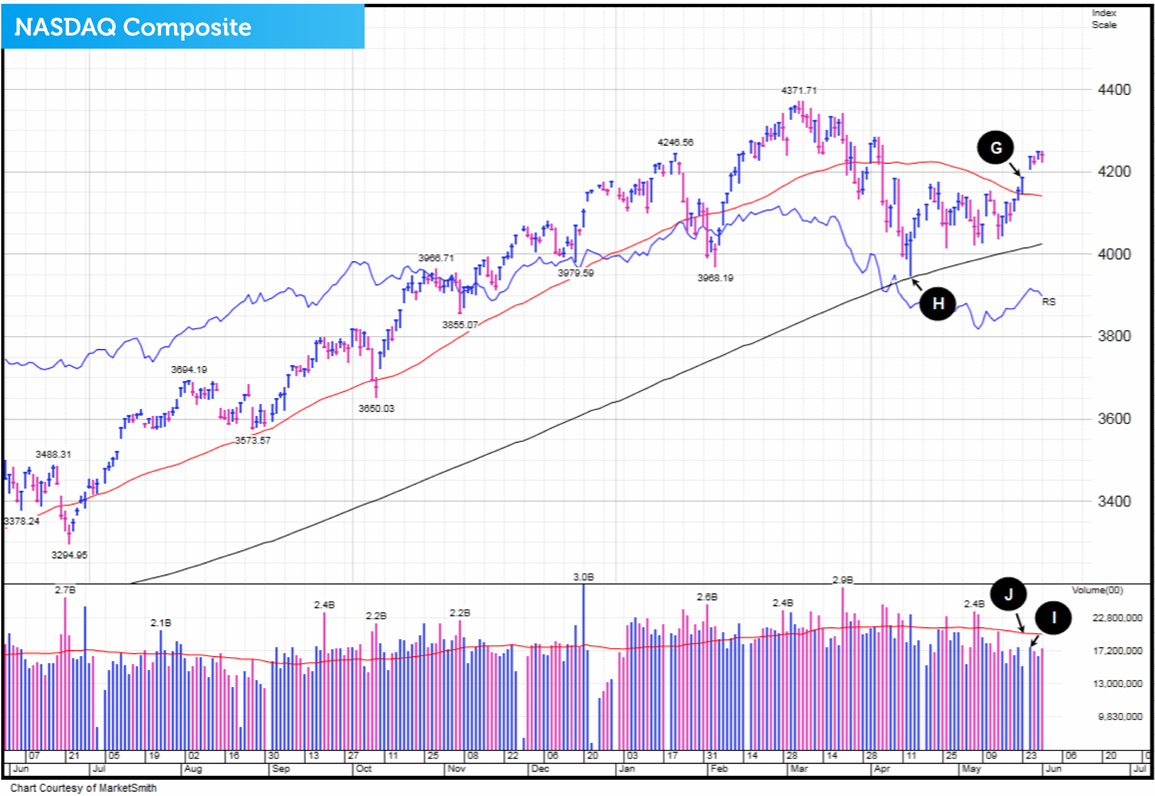
If we look at the plus side of what happened, volume did increase from the previous day (Point I) but it still fell short of its daily average volume (Point J). This means it was not only late, it was also weak. The S&P 600 did a little better with a day 7 follow through but it was a similar picture to the NASDAQ's with price and volume action falling short of what we ideally like to see.
Iffy behaviour not normally seen in a bull market
As we closed out the month of May, we noticed weakness in the S&P 600, the small cap index, which is not typical during bull markets. Look how its RS line has recently been trending downwards (Point K).
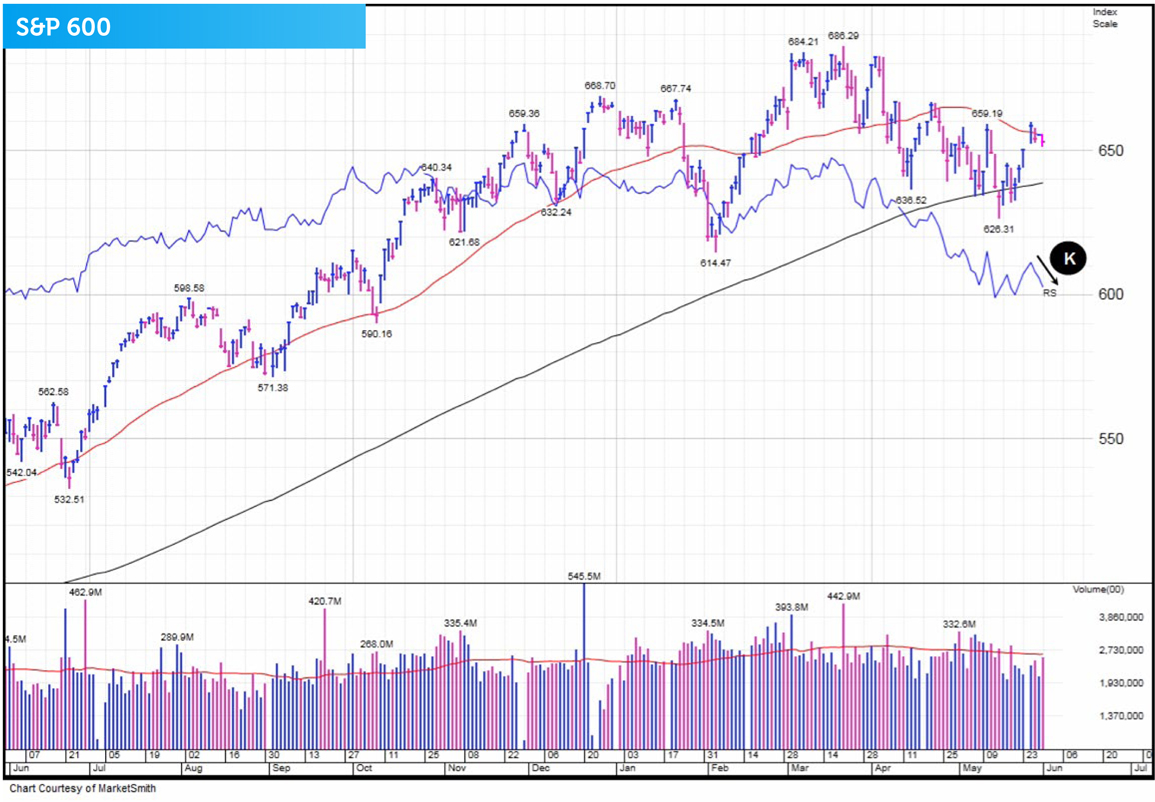
This downwards pointing RS line means the S&P 500, an index which is normally weaker than the 600 during bull markets, has been recently acting much stronger. This is abnormal behaviour and known as a bearish divergence.
Further signs of weakness
We have also recently noticed a distinct lack of breadth of institutional buying. Capital appears to be coming out of solid growth opportunities such as small and mid cap names and into either defensive plays or beaten down junk. Spotty behaviour has been noted of late from leading stocks and without the participation of a large number of top equities surging ahead, this latest rally attempt is more likely to fail. There is also a distinct lack of volume when the market rises which is also irregular and normally indicates a lack of demand for stocks at these levels.
Trying to find a needle in a haystack
We have also been finding it difficult to locate good solid buying opportunities – probably because of the lack of breadth of institutional buying. Normally in healthy markets, the breadth of buying is vast meaning we are normally spoilt for choice. One last thing to take into account is the up and coming summer doldrums. Normally during the summer months not much price progress is made by the indexes. Also during this period the majority of funds tend to not make a decent return. That means that this up and coming event also has to be considered within the grand scheme of things.
NASDAQ Composite breaks out
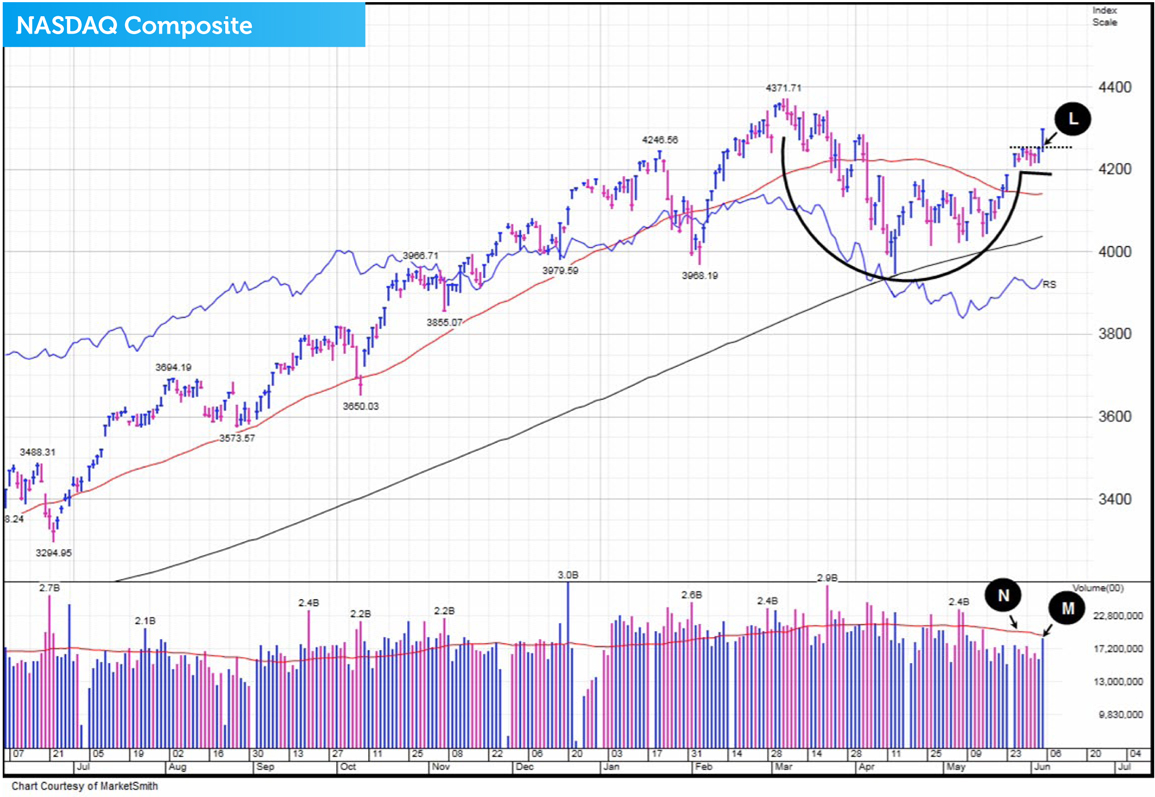
As you can see on this 12 month chart, on Thursday 5th June, the NASDAQ Composite broke out of a cup-with-handle base pattern (Point L). Volume was below average (Point M) which is not ideal. In a perfect situation, trade would be far above its 50-day average line (Point N) indicating that institutional investors were piling into stocks. The breakout therefore wasn’t perfect, but it was encouraging to see, especially with all the recent mixed messages that the market has been dishing out.
This information is taken from The Big Picture, to download a sample copy please just click here.
This information is taken from The Big Picture, to download a sample copy please just click here.
As always, if you have any questions or thoughts on the points covered in this post, please leave a comment below or connect with us @ISACO_ on Twitter.
About ISACO
ISACO specialises in ISA and SIPP Investment and is the pioneer of ‘Shadow Investment’; an easy way to grow your ISA and SIPP at low cost. Together with our clients, we have an estimated £57 million actively invested in ISAs and pensions*. Clients like us because we have a great track record of ‘beating’ the FTSE 100**. Over the last 16 years, we’ve outperformed the Footsie by 60.2% and over the last 5 years, we’ve averaged 14.5% each year versus the FTSE 100’s 8.8%. You can find us at www.ISACO.co.uk.
What is Shadow Investment?
Picking the right fund for your ISA and SIPP is not exactly the easiest job in the world. And knowing 'when' to buy and 'when' to exit is even more difficult! Our ‘Shadow Investment’ Service is here to help. Our service allows you to look over our shoulder and buy the same funds that we are buying.
When we are thinking of buying a fund, we alert you so that you have the opportunity to buy it on the same day that we buy it. We also tell you about when we are planning to exit the fund. You control your investment account, not us. You can start small and invest as little or as much money as you like.
By knowing what we are buying, when we are buying and when we are exiting, throughout the year you can mirror our movements and in effect replicate our trades. This means you have the opportunity to benefit from exactly the same investment returns that we get. Our investment aims are 10–12% per year.
We are totally independent, fully transparent and FCA compliant. We’re warm, friendly and highly responsive and it’s a very personal service that gives you direct access to the Sutherland brothers; ISACO’s two founders.
Who are ISACO’s clients?
Clients who benefit most from our service have over £250,000 actively invested and the majority of them are wealthy retirees, business owners, self-employed professionals and corporate executives. We also have clients from the financial services sector, such as IFAs and wealth managers.
Do you have questions?
To have all your questions answered, call 0800 170 7750 or email us at: info@ISACO.co.uk.
*November 15th 2012: Internal estimation of total ISA and pension assets owned by ISACO Investment Team and ISACO premium clients.
**Long-term performance: December 31st 1997 - December 31st 2013 ISACO 91.3%, FTSE 100 31.1%. 5 year performance: December 31st 2008 - December 31st 2013. ISACO Investment performance verified by Independent Executives Ltd.
> " target="_self"> To download our free report 'A Golden Opportunity' >>
>" target="_self"> To download our Shadow Investment brochure >>
> " target="_self"> To start your 14 day free 'no obligation' trial of Shadow Investment >>


