This is the first in a new series of posts, where we'll look in detail at timing your fund investments.
If you would like to know more, please just download our free report Fund Timing: When to Buy and When to Exit.
After speaking to a huge number of DIY investors over the past 15 years, we’ve learned that many feel reasonably comfortable selecting which funds to invest in but have problems knowing when to buy and when to exit. We’ve also found that most investors become uncertain about whether to hold on to their fund once they’ve bought it, especially if it drops in price just after they’ve purchased it.
They also tend to get very nervous as soon as it experiences its first major correction – which of course all funds will do. They think, is this normal? Should I sell it or should I hold? What if I sell it and it goes up? What if I keep it and it continues to go lower? You see, when a fund heads south, many private investors have no idea whether the behaviour is normal and healthy or abnormal and unhealthy.
Because of this lack of financial literacy, the uneducated investor will make a decision based on how they feel, which in most cases will unfortunately turn out to be a bad call. The thing is, getting your timing right is very difficult and requires knowledge, skill and tons of experience. We do this for a living and we never get our timing right all the time.
To become good, it takes lots of effort and bags of patience. If it’s really important to you to become good in timing the market, we're certain that this series of posts will help you to eventually master it. And if you do become good at it, this newly acquired skill of yours will probably result in a marked improvement in your investment returns. Let's start by looking at when to buy.
When to buy
Buying a fund at the optimum time starts with looking at the current market direction. Why? The majority of stocks (approximately 75%) tend to move in the same direction as the market. Funds own stocks and therefore funds also move in the same direction as the market. Therefore, even if you are fantastic at picking the best fund, if you are wrong about the trend of the market your portfolio is going to suffer.
Markets work in cycles and consist of a bull and a bear market. Bull markets are the upwards part of the cycle and last between two and four years. Bear markets head downwards and last approximately nine to eighteen months. Because bull markets last longer, the stock market over the long term forms an uptrend. Think of a staircase and think three stairs up (bull market), one stair down (bear market).
Find a fund that’s suitable
Once you’ve completed your analysis of the market, if you believe that it’s in a long-term uptrend (bull market), your focus can then move towards finding a fund that matches your risk profile and objectives. We like to focus on the past performance of the present fund manager and we also like to make sure that the manager has proved that they have beaten the market in the past and are beating it right now.
Check its chart pattern
Once you’re happy with market direction and you’ve identified a fund that you like and you feel is suitable, the last part of the jigsaw is timing your buy. The key is being able to recognise two specific trading patterns as well as determining the proper buy points. Before a fund can launch a big price run up, it must have a solid base pattern to build upon. Base patterns occur when a fund's price falls and consolidates over a series of weeks or months or even years.
Most of them (80–90%) are created and formed as a result of corrections in the general market. Bases typically form after a fund has already experienced a nice increase in its price – also known as an uptrend – of at least 30%. That uptrend is important because it shows you the fund has built up a record of price growth already, and the stocks the fund owns have received support from some big professional investors. There are several kinds of bases that winning funds frequently form prior to a big price run-up.
Let's look at the two most popular:
Cup-with-handle base pattern
Learning to recognise the cup-with-handle pattern on a chart helps you aim to buy in before the fund begins its big run. The cup-with-handle base is one of the easiest patterns to spot – and probably the most powerful. On a chart it resembles a teacup as seen from its side view.
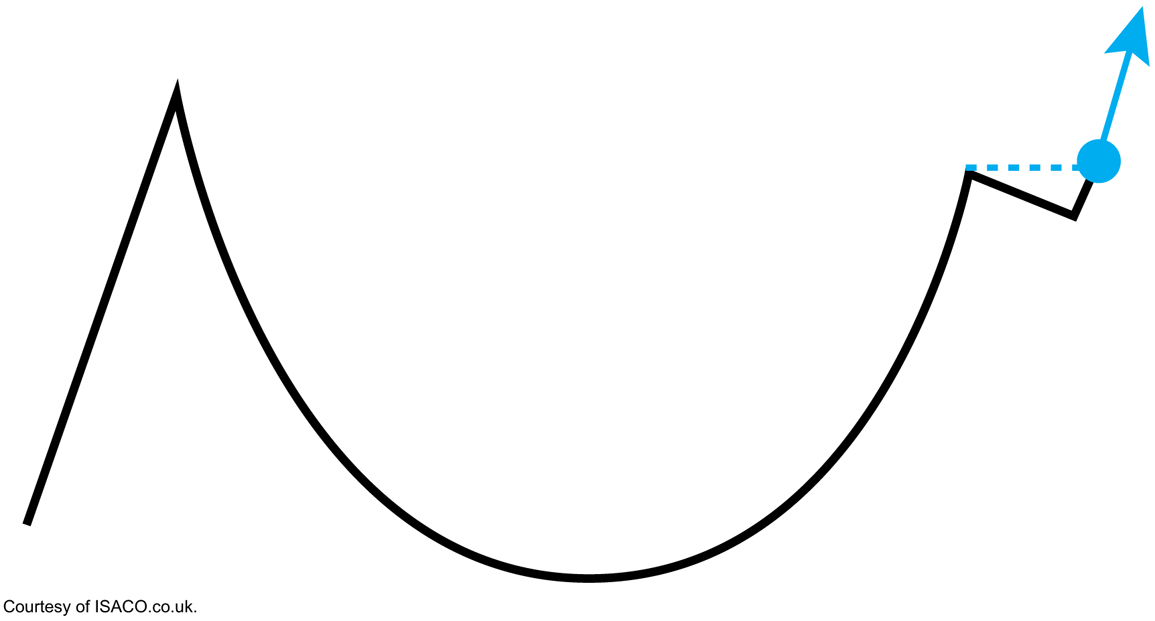
During the final stage of the base – after the fund has climbed up the right side of the pattern – it may pull back, etching a downward-sloping handle on its chart. The key is to watch for the fund price ‘breaking out’ of the pattern, which is the best time to buy.
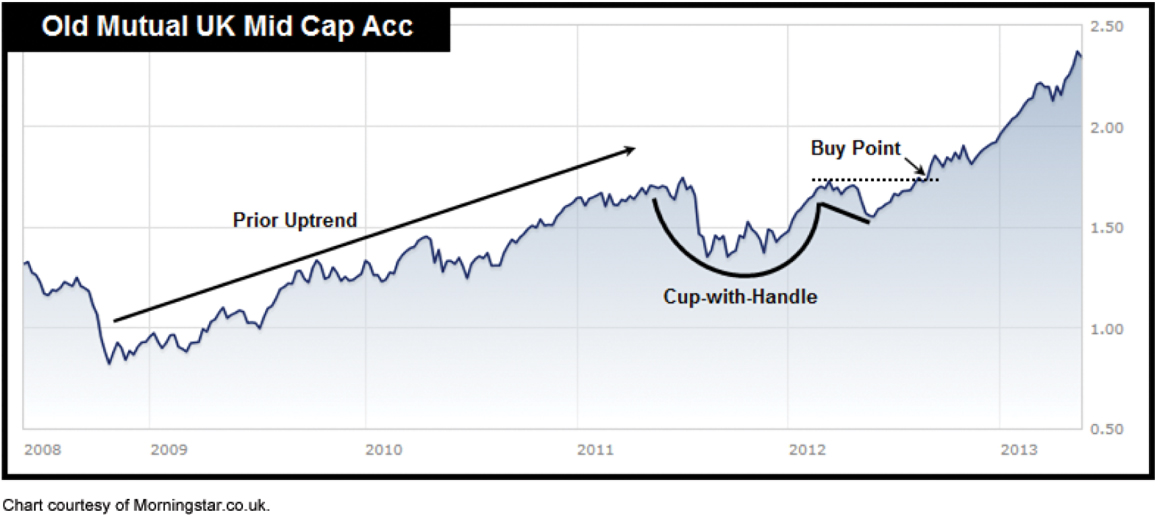
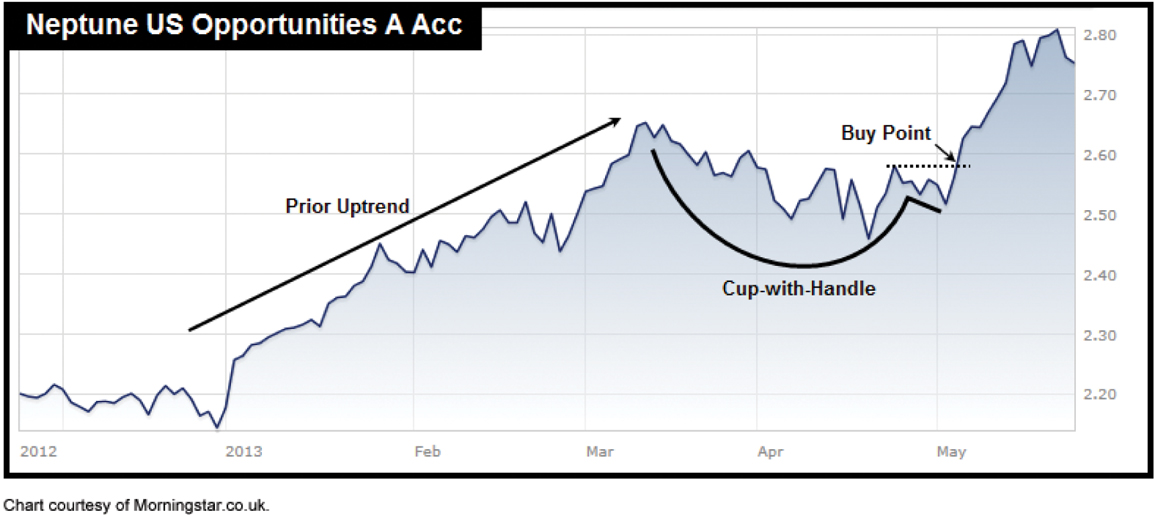
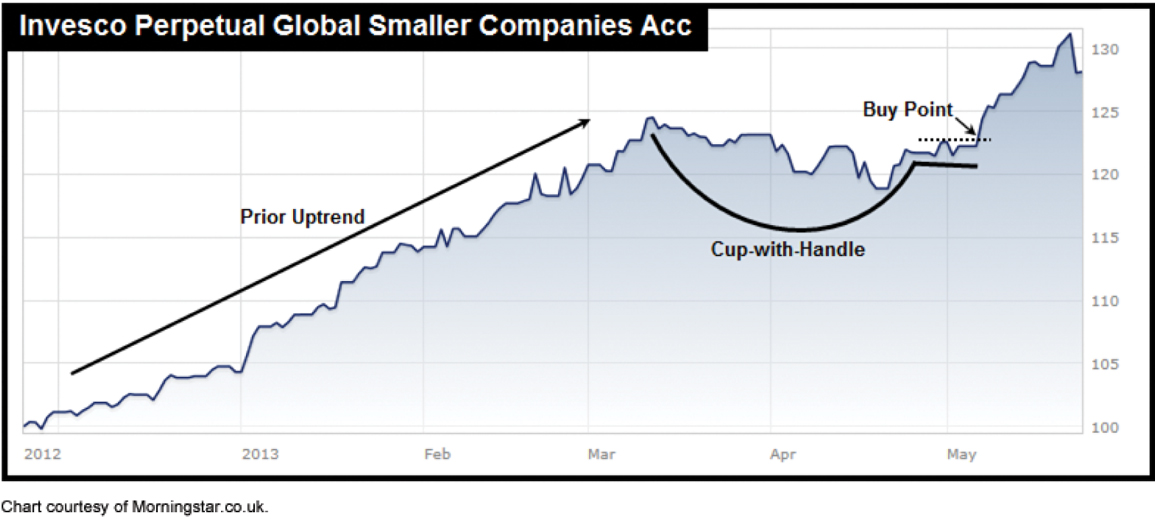
Three cup-with-handle examples
Buying at the wrong time
Some investors who learn about cup-with-handle formations ask the question, ‘why not buy when the fund is at the bottom of its base at a lower price?’ The reason we avoid buying at the bottom is simply because it’s too risky. From our experience, we've found that buying at the bottom of the base results in a greater likelihood that the fund will head either lower or sideways (instead of upwards) after purchasing it.
Buying too early
Next, we want to show you two examples of funds we personally owned where we bought too early. The first is the Fidelity Funds - India Focus Fund A-GBP.
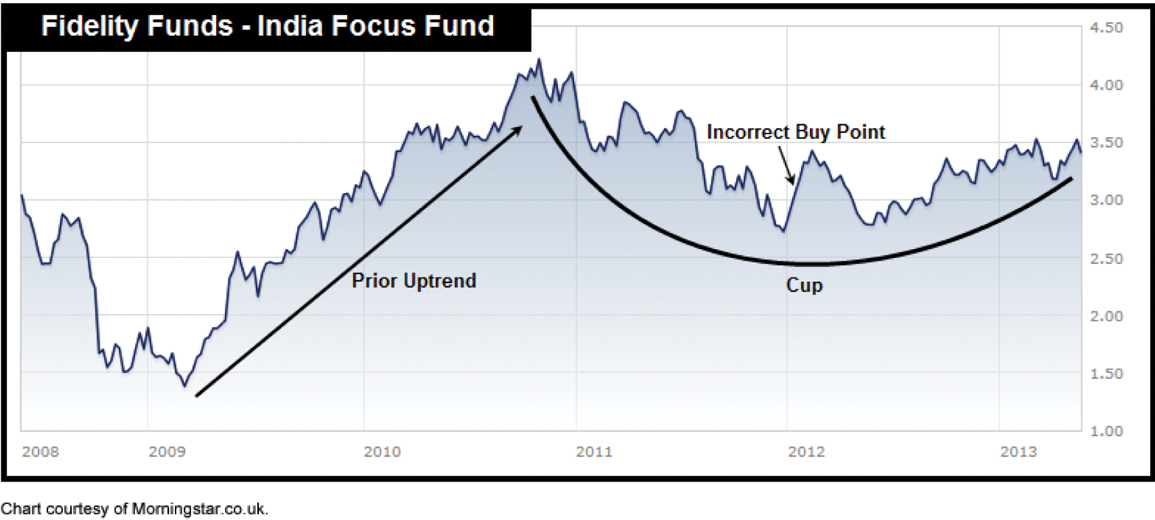
We bought this one on January 24th 2012 at a price of 3.12 and sold it on March 11th 2013 at 3.53. Even though we made a 13.1% gain in 14 months, we sold it because when we buy a fund our expectations are for it to outperform the market however, this one underperformed.
The second example of a fund we bought too early is one called the Neptune Russia & Greater Russia A. We bought and sold this fund on exactly the same days that we bought and sold the India fund.
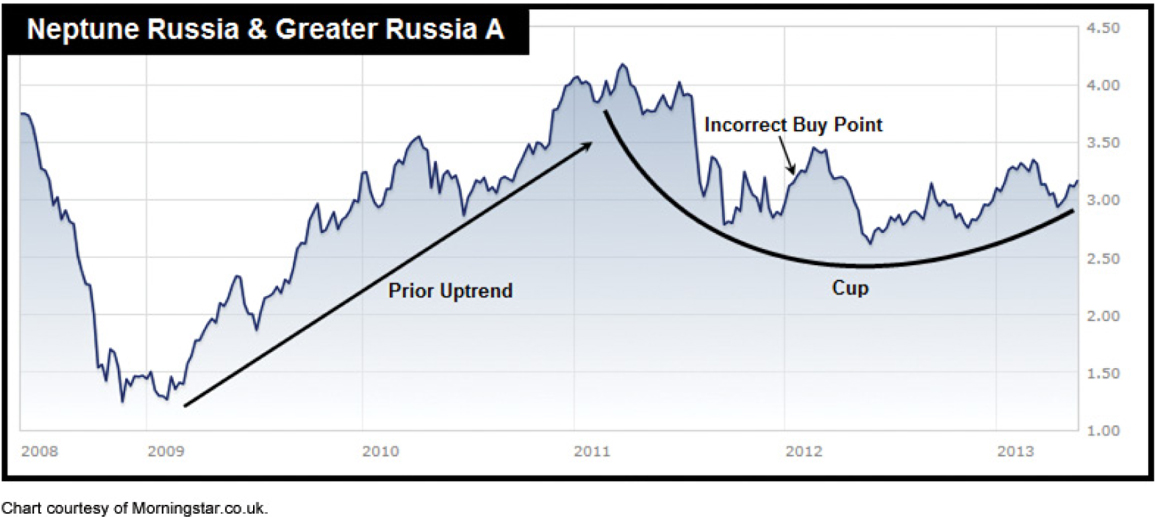
This one performed even worse than the India fund and resulted in a 1.6% loss. A loss of less than 2% might not seem that bad but during the period we held it, the market was moving up and so were many funds. These two mistakes were sloppy of us. We very rarely deviate from our rule of aiming to buy funds when they are breaking out into new high ground however, after making the fatal mistake of trying to get in early, it reminded us that trying to buy low is a flawed strategy.
We’ve found that it’s always best to buy when the fund has plenty of upwards momentum and is just about to emerge out of a consolidation pattern, such as a cup-with-handle or a flat base, which is a pattern we’ll be looking at shortly. Firstly, though, take a look at two examples of buying a fund at the right time.
Buying at the right time
The first example is a fund called the Schroder UK Mid 250 A ACC.
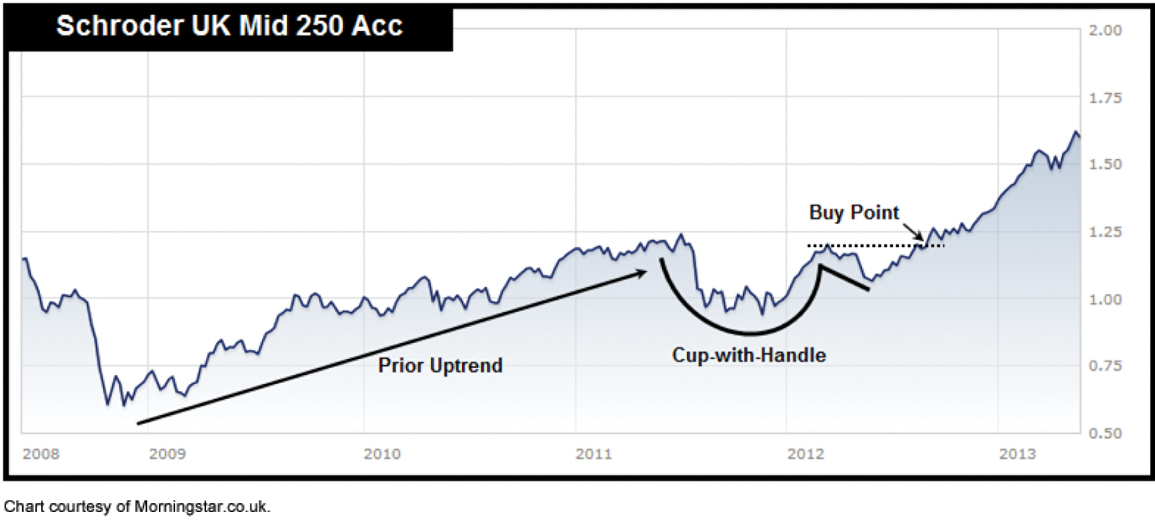
We purchased it on July 24th 2012 at a price of 1.31. Notice that we bought this after it had completed its cup-with-handle formation and just after buying, it took off like a rocket. In the first twelve months of owning it, this beauty surged 50.4%.
The Invesco Perpetual UK Growth ACC was purchased on the same day (July 24th 2012) as the Schroder fund, at a price of 3.41.
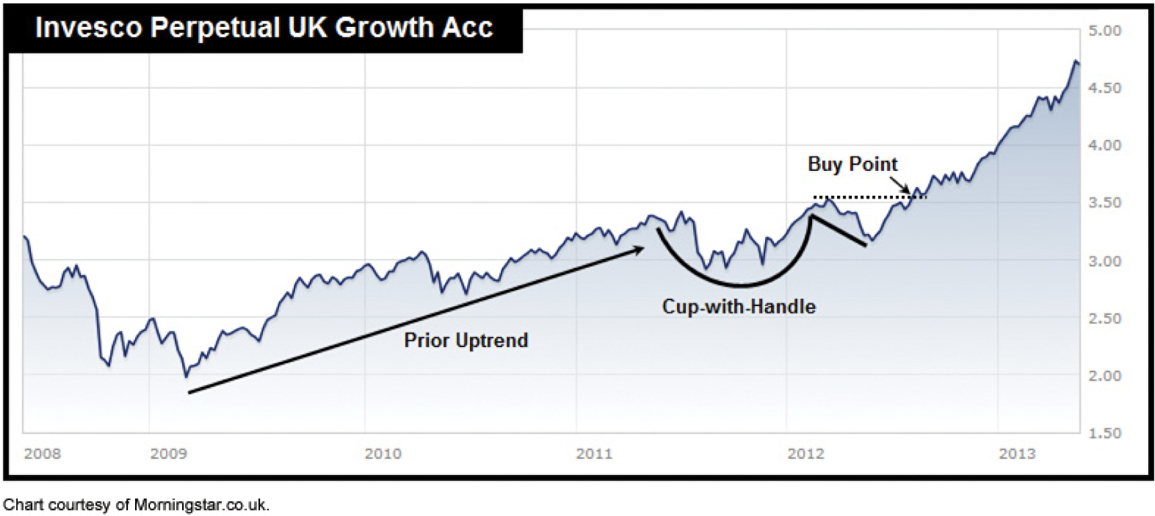
Notice once again that we bought it after it had completed its cup-with-handle formation. This darling also made a substantial move in the first twelve months that we owned it, vaulting 43.1%.
In our next post in this series we'll look at another chart pattern, the flat base pattern. Remember, if you would like to know more, please just download our free report Fund Timing: When to Buy and When to Exit.
As always, if you have any questions or thoughts on the points covered in this post, please leave a comment below or connect with us @ISACO_ on Twitter.
About ISACO
ISACO specialises in ISA and SIPP Investment and is the pioneer of ‘Shadow Investment’; an easy way to grow your ISA and SIPP at low cost. Together with our clients, we have an estimated £57 million actively invested in ISAs and pensions*. Clients like us because we have a great track record of ‘beating’ the FTSE 100**. Over the last 16 years, we’ve outperformed the Footsie by 60.2% and over the last 5 years, we’ve averaged 14.5% each year versus the FTSE 100’s 8.8%. You can find us at www.ISACO.co.uk.
What is Shadow Investment?
Picking the right fund for your ISA and SIPP is not exactly the easiest job in the world. And knowing 'when' to buy and 'when' to exit is even more difficult! Our ‘Shadow Investment’ Service is here to help. Our service allows you to look over our shoulder and buy the same funds that we are buying.
When we are thinking of buying a fund, we alert you so that you have the opportunity to buy it on the same day that we buy it. We also tell you about when we are planning to exit the fund. You control your investment account, not us. You can start small and invest as little or as much money as you like.
By knowing what we are buying, when we are buying and when we are exiting, throughout the year you can mirror our movements and in effect replicate our trades. This means you have the opportunity to benefit from exactly the same investment returns that we get. Our investment aims are 10–12% per year.
We are totally independent, fully transparent and FCA compliant. We’re warm, friendly and highly responsive and it’s a very personal service that gives you direct access to the Sutherland brothers; ISACO’s two founders.
Who are ISACO’s clients?
Clients who benefit most from our service have over £250,000 actively invested and the majority of them are wealthy retirees, business owners, self-employed professionals and corporate executives. We also have clients from the financial services sector, such as IFAs and wealth managers.
Do you have questions?
To have all your questions answered, call 0800 170 7750 or email us at: info@ISACO.co.uk.
*November 15th 2012: Internal estimation of total ISA and pension assets owned by ISACO Investment Team and ISACO premium clients.
**Long-term performance: December 31st 1997 - December 31st 2013 ISACO 91.3%, FTSE 100 31.1%. 5 year performance: December 31st 2008 - December 31st 2013. ISACO Investment performance verified by Independent Executives Ltd.
> " target="_self"> To download our free report 'A Golden Opportunity' >>
>" target="_self"> To download our Shadow Investment brochure >>
> " target="_self"> To start your 14 day free 'no obligation' trial of Shadow Investment >>


