In this post we'll take a look at what has been happening in the market since early October.
This information is taken from The Big Picture, to download a sample copy please just click here.
Is the market healthy or unhealthy?
The way we use to check if the market is behaving as it should is to look at the trading action (price and volume activity) of institutional investors. Why do we do this? The stock market is about six month forward looking and its daily activity is the consensus conclusion whether institutional investors like or don’t like what they see happening down the road. By watching what the big players are doing (buying or selling) each and every day, it can provide essential clues to which way the market is likely to head.
It’s best to try to get ‘in sync’
Institutional investors control approximately 75% of the market’s future direction, which is why we aim to keep ‘in sync’ with them. If you don’t, it feels like trying to swim against a strong current. When you don’t get in sync, you often get hurt financially and that’s why we like to see if the 800-pound gorilla investors are buying, because when they do, it strengthens the market.
However, if they are selling, it weakens it. The other thing we like to keep a close eye on is the behaviour of leading stocks. If the market's best stocks are acting weaker than the general averages, it’s negative. However when leading stocks are outperforming the market, it’s positive.
Bull market? Bear market? Where are we?
Take a look at this 20-year chart of the NASDAQ Composite and you’ll see that the bull market that began in March 2009 (Point A) is just five and a half years old and for now remains intact.
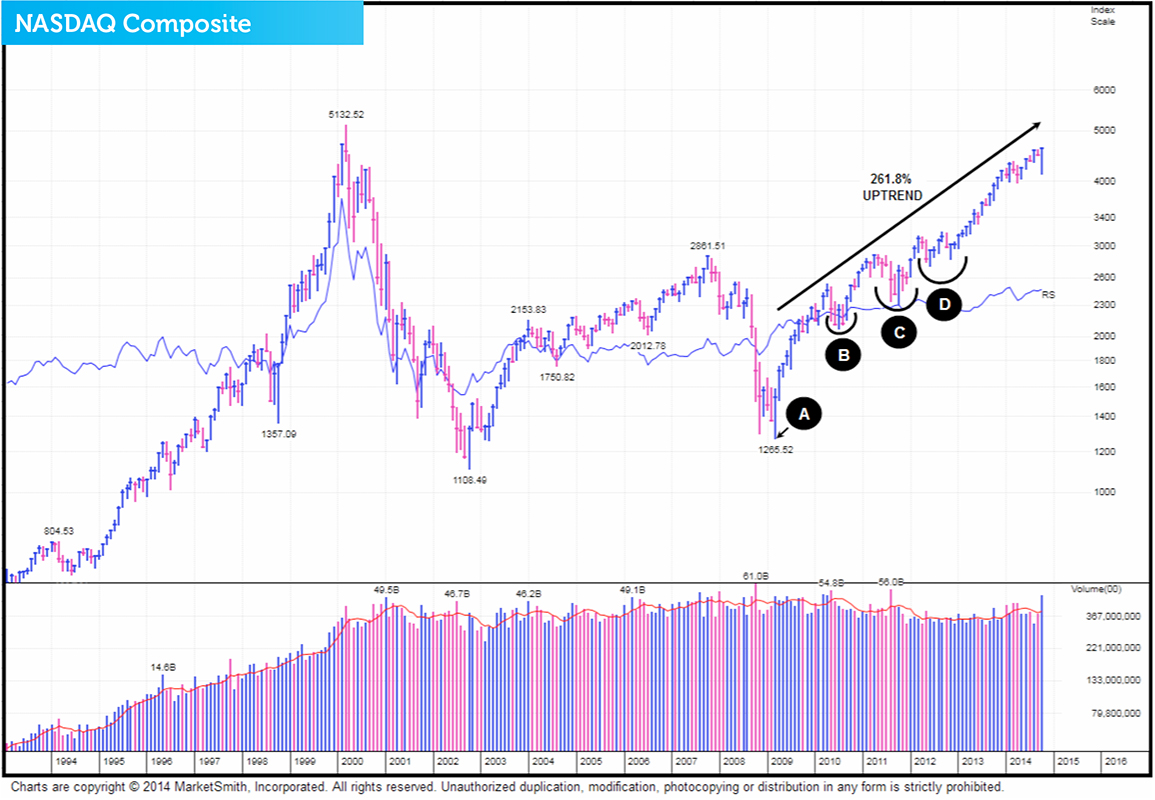
Since the uptrend began, the NASDAQ Composite has made a very impressive 261.8% return. However, to make that gain it has had to experience three challenging corrections. The first (Point B) occurred from April to November 2010. The second (Point C) is a correction that started in May 2011 and ended in January 2012. The third (Point D), began in late March 2012 and finished March 2013. Since then we have had several correction periods but none of them have been as severe as these three.
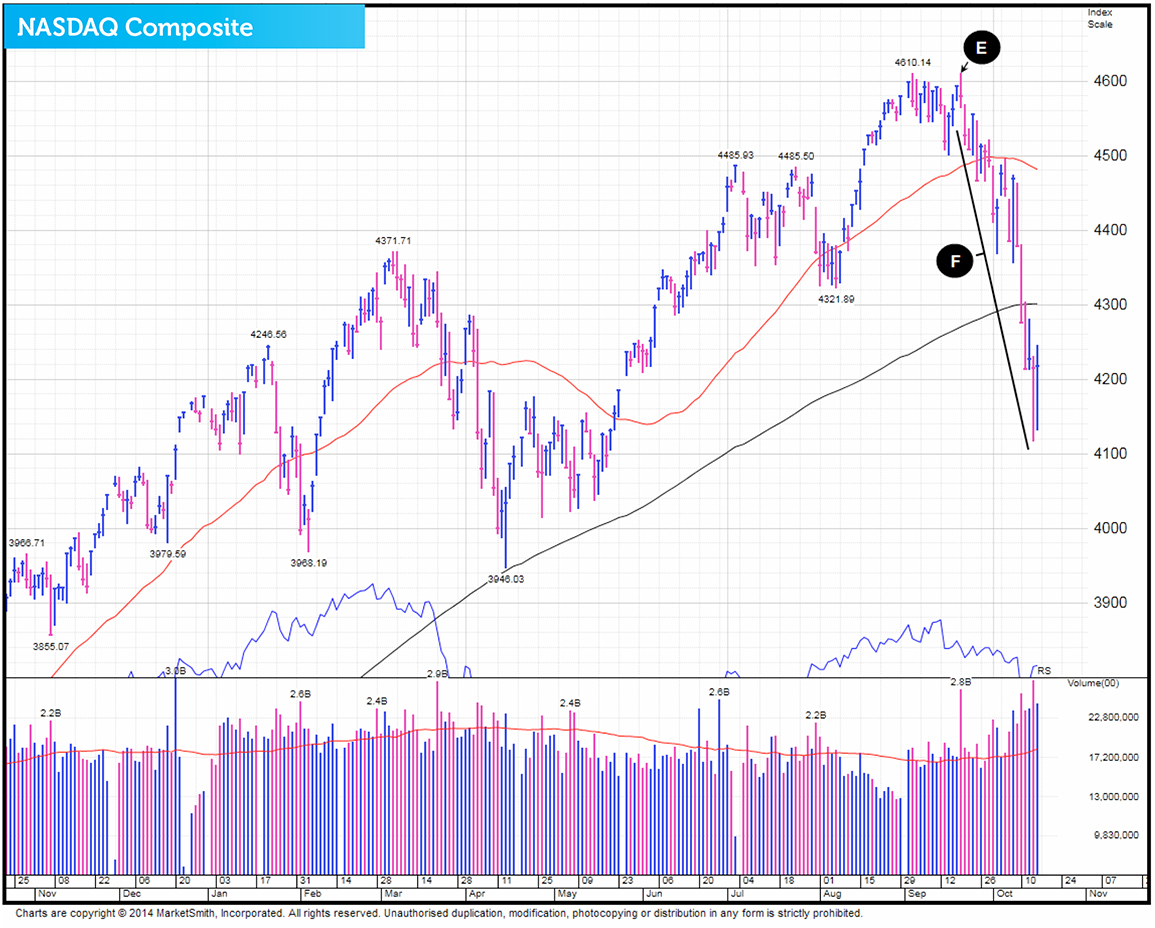
Another healthy bull market correction
The correction that began 19th September (Point E) was a normal and natural retracement period. These pullbacks tend to be not as deep nor do they last as long as fully blown bear market corrections. A key characteristic of bear markets is that the majority of leading stocks fall like stones from the sky and fortunately this is something that did not occur when the market was recently in freefall mode (Point F).
To continue on this theme look at the bar chart below that shows comparisons between our own portfolio’s performance and our two benchmarks during this period when the market indexes were plunging:
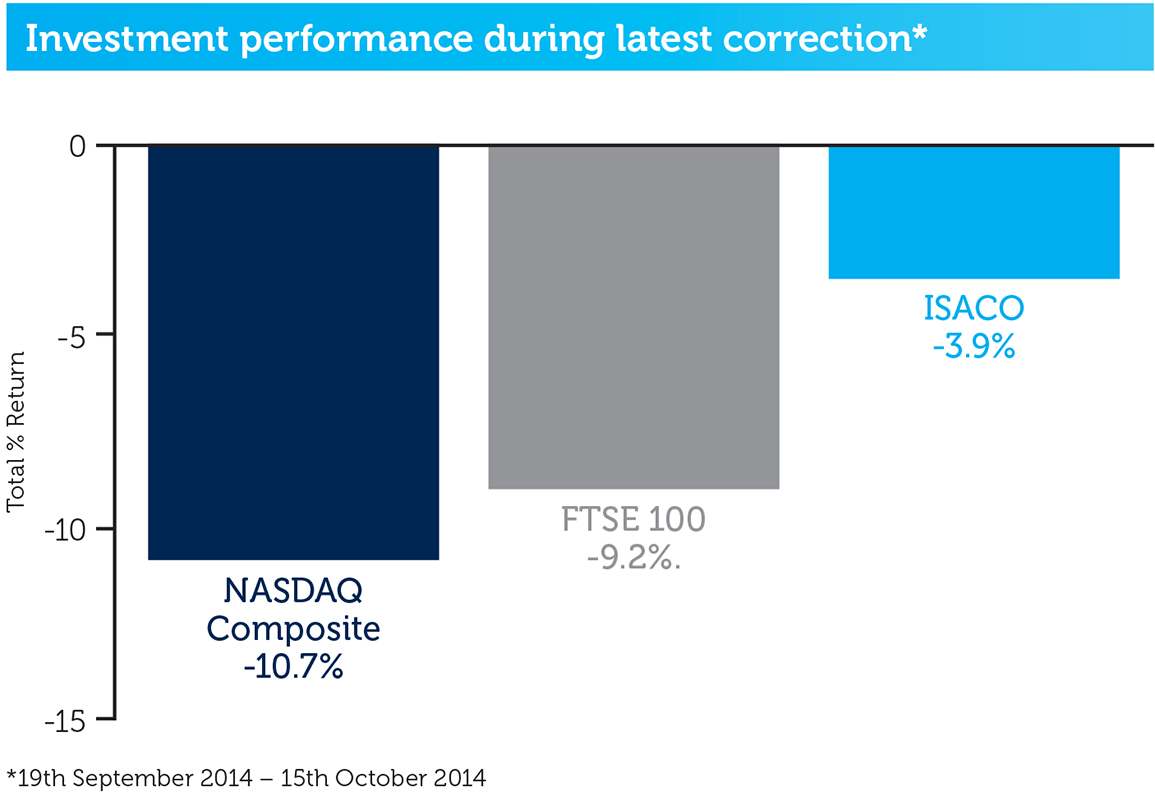
As you can see from the chart, during the heavy falls the NASDAQ Composite dropped -10.7%, the FTSE 100 fell -9.2% and we retreated -3.9%. This ‘outperformance’ of ours not only fills us with pride and joy but also highlights a key lesson about what typically happens to a seasoned investor's portfolio during a normal bull market correction. In other words, if this retracement would have been something more sinister and likely to lead into a severe and brutal bear market (index corrections of 20% plus), our portfolio would not have performed as it did. Instead it would have been completely ravaged.
This information is taken from The Big Picture, to download a sample copy please just click here.
As always, if you have any questions or thoughts on the points covered in this post, please leave a comment below or connect with us @ISACO_ on Twitter.
About ISACO
ISACO specialises in ISA and SIPP Investment and is the pioneer of ‘Shadow Investment’; an easy way to grow your ISA and SIPP at low cost. Together with our clients, we have an estimated £57 million actively invested in ISAs and pensions*. Clients like us because we have a great track record of ‘beating’ the FTSE 100**. Over the last 16 years, we’ve outperformed the Footsie by 60.2% and over the last 5 years, we’ve averaged 14.5% each year versus the FTSE 100’s 8.8%. You can find us at www.ISACO.co.uk.
What is Shadow Investment?
Picking the right fund for your ISA and SIPP is not exactly the easiest job in the world. And knowing 'when' to buy and 'when' to exit is even more difficult! Our ‘Shadow Investment’ Service is here to help. Our service allows you to look over our shoulder and buy the same funds that we are buying.
When we are thinking of buying a fund, we alert you so that you have the opportunity to buy it on the same day that we buy it. We also tell you about when we are planning to exit the fund. You control your investment account, not us. You can start small and invest as little or as much money as you like.
By knowing what we are buying, when we are buying and when we are exiting, throughout the year you can mirror our movements and in effect replicate our trades. This means you have the opportunity to benefit from exactly the same investment returns that we get. Our investment aims are 10–12% per year.
We are totally independent, fully transparent and FCA compliant. We’re warm, friendly and highly responsive and it’s a very personal service that gives you direct access to the Sutherland brothers; ISACO’s two founders.
Who are ISACO’s clients?
Clients who benefit most from our service have over £250,000 actively invested and the majority of them are wealthy retirees, business owners, self-employed professionals and corporate executives. We also have clients from the financial services sector, such as IFAs and wealth managers.
Do you have questions?
To have all your questions answered, call 0800 170 7750 or email us at: info@ISACO.co.uk.
* November 15th 2012: Internal estimation of total ISA and pension assets owned by ISACO Investment Team and ISACO premium clients.
** Long-term performance: December 31st 1997 - December 31st 2013 ISACO 91.3%, FTSE 100 31.1%. 5 year performance: December 31st 2008 - December 31st 2013. ISACO Investment performance verified by Independent Executives Ltd.
> " target="_self"> To download our free report 'A Golden Opportunity' >>
>" target="_self"> To download our Shadow Investment brochure >>
> " target="_self"> To start your 14 day free 'no obligation' trial of Shadow Investment >>


