This information is taken from The Big Picture, to download a sample copy please just click here.
NASDAQ follows through
On Tuesday 21st October, the NASDAQ Composite surged 2.40% (Point G) in above average volume (Point H). This was the US technology indexes’ best one-day gain so far this year.
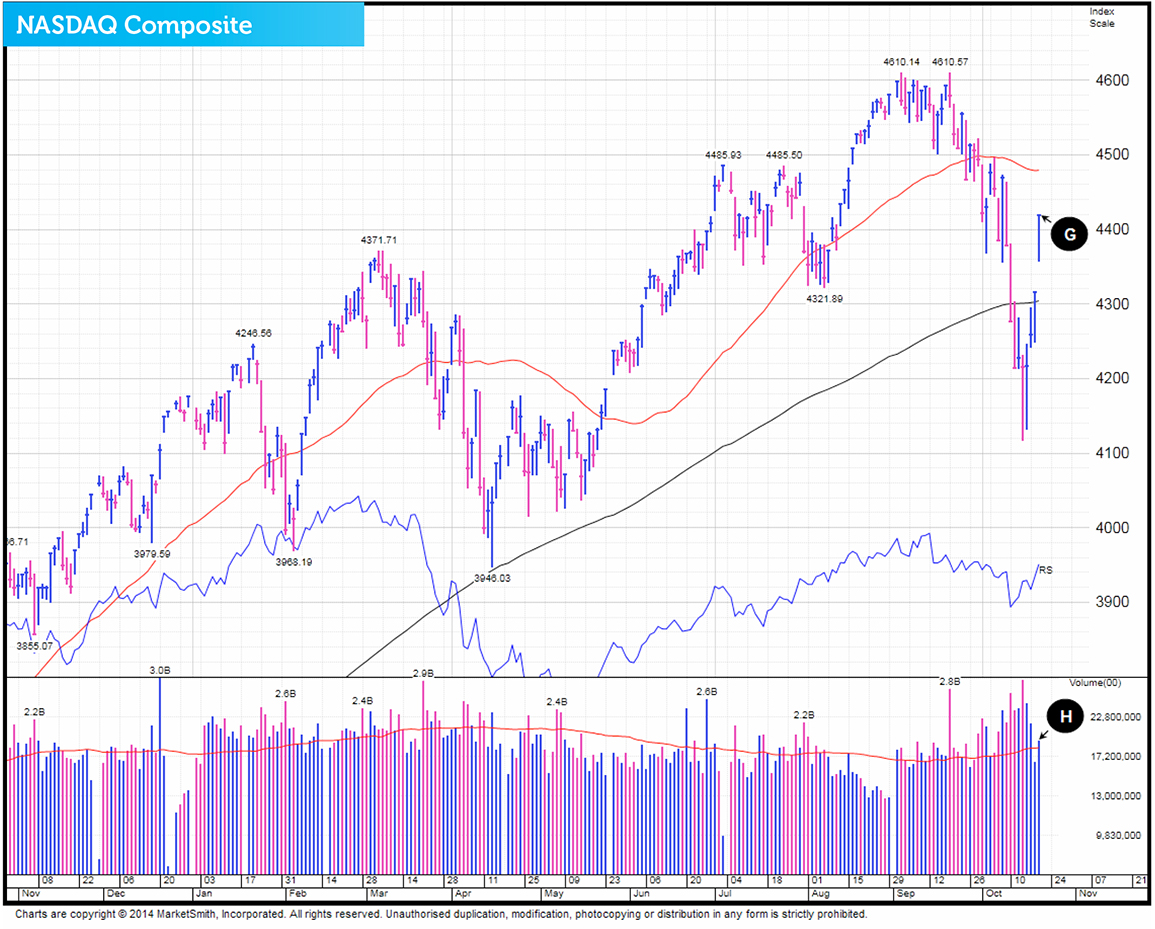
Coupled with a solid increase in volume, the US technology index made a ‘follow-through’ signal, which changed our short-term outlook at the time from neutral to bullish. The follow-through is the best signal that a new market uptrend is underway.
At the time, William O’Neil’s website, Investors.com had this to say: “The magnitude of the move was compelling. Gains were far stronger than in the previous four follow-throughs, which occurred on 13th August, 27th May and 11th February 11 this year and 16th October last year. Indexes on those days rose 1% to 1.4% and led to decent gains each time.”
Clear sign of trend reversal
When we analysed the market on Thursday 30th October 2014, the NASDAQ Composite had had nine up days in eleven trading sessions (Point I). This in itself was a clear sign that the trend of the market had recently changed from down to up.
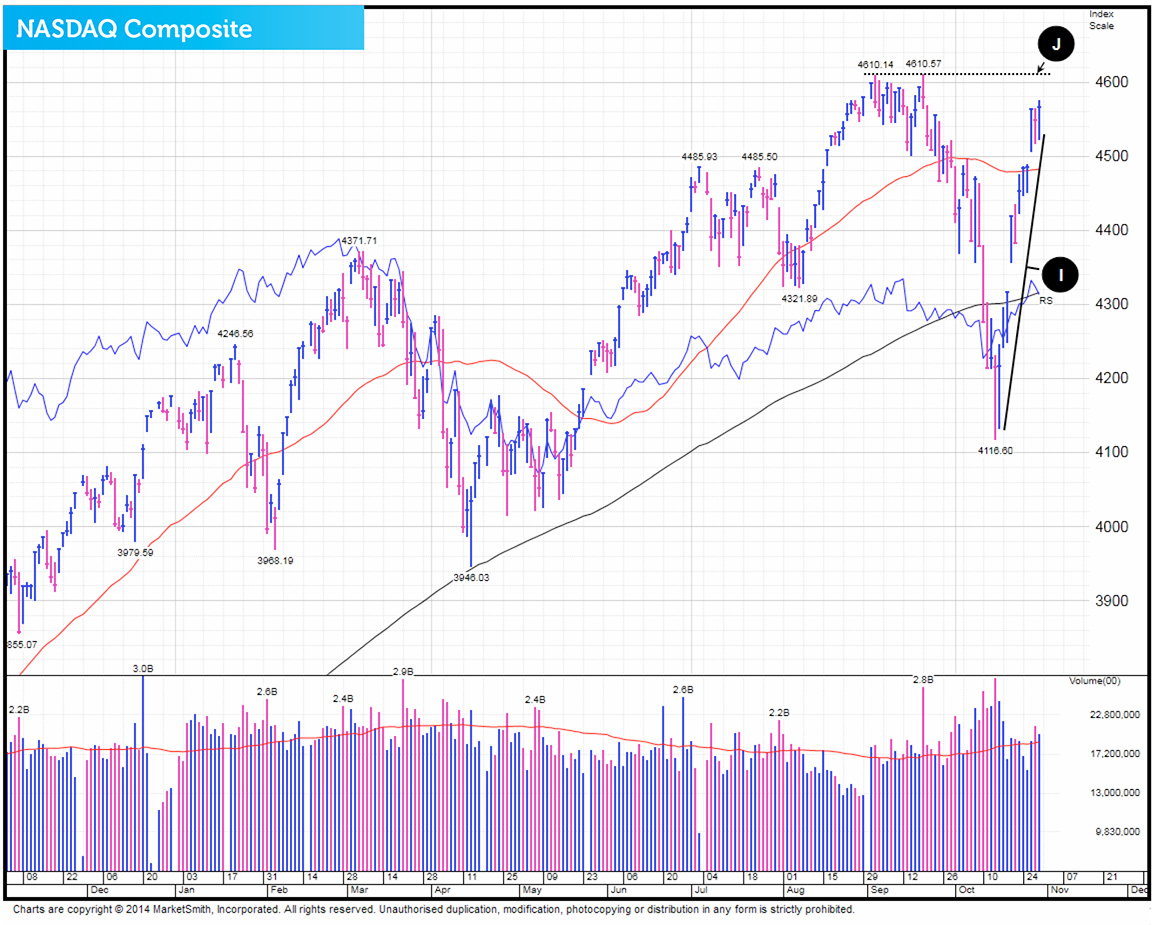
The action over those two weeks also signaled that the market was more likely to go upwards but, to officially end the NASDAQ’s correction, it needed to get back above (and stay above) the resistance at 4611 (Point J).
Bullishly guarding recent gains
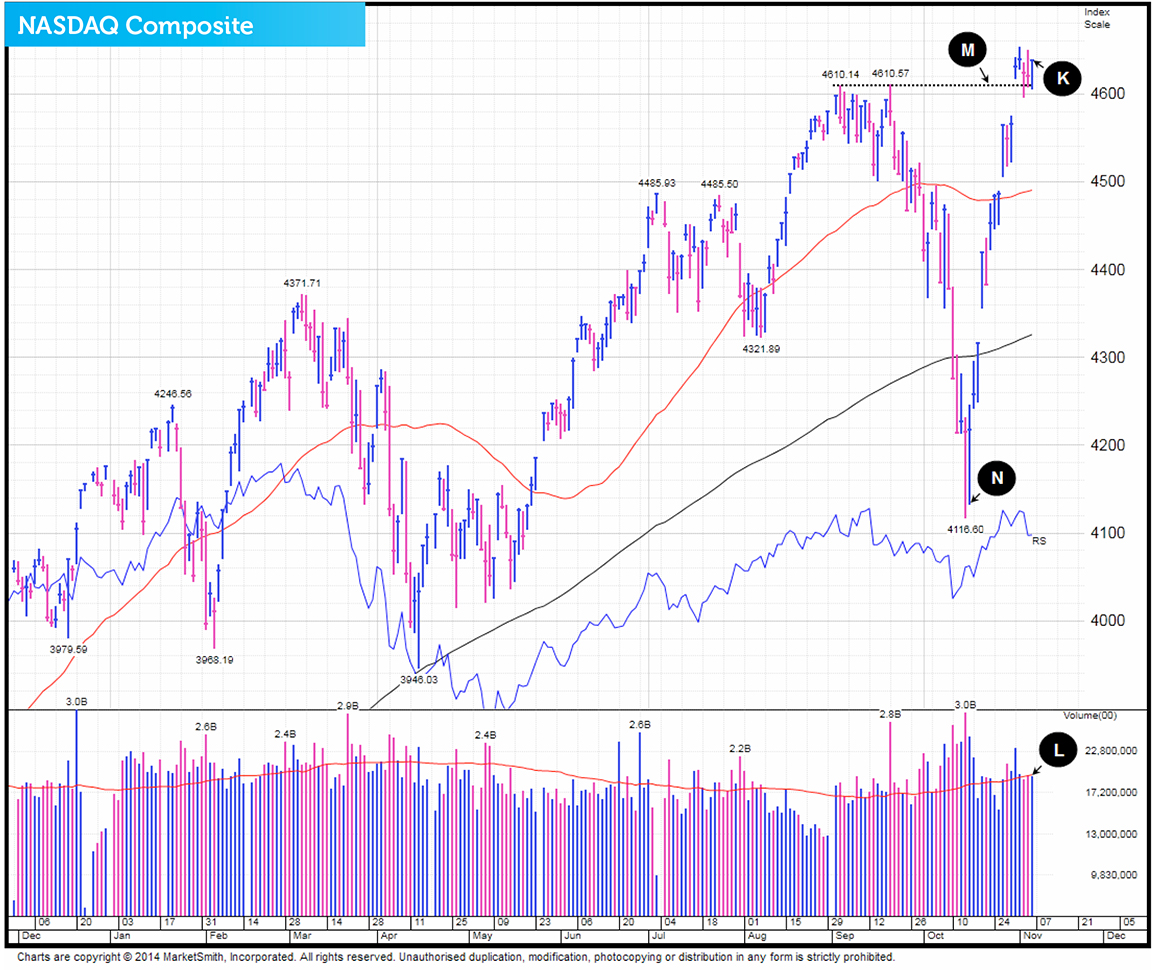
When we took a look at the NASDAQ Composite’s activity on Friday the 7th of November, the index behaviour was positive. The NASDAQ gained 0.38% (Point K) in average volume (Point L). Advances in average or above average volume indicate that institutional investors are accumulating stock – a bullish sign. This up day helped the US technology index regain the previous two days losses.
It was also constructive to see the NASDAQ come down and successfully test the recent breakout level of 4611 (Point M). From here we’d like to see it continuing to bullishly guard the gains it’s made since the 16th of October 2014 (Point N) by either shuffling sideways or continuing its advance in decent trade.
This information is taken from The Big Picture, to download a sample copy please just click here.
As always, if you have any questions or thoughts on the points covered in this post, please leave a comment below or connect with us @ISACO_ on Twitter.
About ISACO
ISACO specialises in ISA and SIPP Investment and is the pioneer of ‘Shadow Investment’; an easy way to grow your ISA and SIPP at low cost. Together with our clients, we have an estimated £57 million actively invested in ISAs and pensions*. Clients like us because we have a great track record of ‘beating’ the FTSE 100**. Over the last 16 years, we’ve outperformed the Footsie by 60.2% and over the last 5 years, we’ve averaged 14.5% each year versus the FTSE 100’s 8.8%. You can find us at www.ISACO.co.uk.
What is Shadow Investment?
Picking the right fund for your ISA and SIPP is not exactly the easiest job in the world. And knowing 'when' to buy and 'when' to exit is even more difficult! Our ‘Shadow Investment’ Service is here to help. Our service allows you to look over our shoulder and buy the same funds that we are buying.
When we are thinking of buying a fund, we alert you so that you have the opportunity to buy it on the same day that we buy it. We also tell you about when we are planning to exit the fund. You control your investment account, not us. You can start small and invest as little or as much money as you like.
By knowing what we are buying, when we are buying and when we are exiting, throughout the year you can mirror our movements and in effect replicate our trades. This means you have the opportunity to benefit from exactly the same investment returns that we get. Our investment aims are 10–12% per year.
We are totally independent, fully transparent and FCA compliant. We’re warm, friendly and highly responsive and it’s a very personal service that gives you direct access to the Sutherland brothers; ISACO’s two founders.
Who are ISACO’s clients?
Clients who benefit most from our service have over £250,000 actively invested and the majority of them are wealthy retirees, business owners, self-employed professionals and corporate executives. We also have clients from the financial services sector, such as IFAs and wealth managers.
Do you have questions?
To have all your questions answered, call 0800 170 7750 or email us at: info@ISACO.co.uk.
* November 15th 2012: Internal estimation of total ISA and pension assets owned by ISACO Investment Team and ISACO premium clients.
** Long-term performance: December 31st 1997 - December 31st 2013 ISACO 91.3%, FTSE 100 31.1%. 5 year performance: December 31st 2008 - December 31st 2013. ISACO Investment performance verified by Independent Executives Ltd.
To download our free report 'A Golden Opportunity' >>
To download our Shadow Investment brochure >>
To start your 14 day free 'no obligation' trial of Shadow Investment >>


