This is the fourth in a series of posts where we're looking at gauging the stock market's direction.
If you would like to know more, please just download our free report How to Gauge Stock Market Direction.
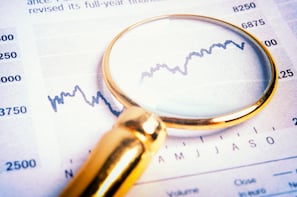
In 2003, the FTSE 100 bottomed at 3392 and in 2009, it hit a low of 3461. Who would have thought that the FTSE 100 would revisit a similar price point again? Between 2008 and 2009, some of world’s most respected companies lost as much as 90% of their share value and that’s the reason why we all may need to look beyond fundamentals. Technical analysis is different to looking at fundamentals. It looks at chart trends and asks the question, is the market in an uptrend or a downtrend?
Is technical analysis the solution?
While technical analysis is not a perfect solution, it can often provide an effective way to help you gauge market direction. It can also remove the emotional element of stock market investing. Fundamentally, you can look at corporate profits, GDP growth, unemployment, inflation and price/earnings ratios to try to determine if the general market is under or overvalued.
Adding technical analysis to your tool box aims to keep you invested when trends are up. On the other hand, it also aims to get you out of the market when major downtrends have been triggered. Before you decide to invest, you could ask – is the market and the fund I’m thinking of buying in an uptrend? If the trend is up, you would have more confidence issuing a buy order.
If the trend is down, you may decide to remain in cash until an uptrend has been established. In a down market, even funds run by star-performing fund managers follow the same direction as the market – just one of the reasons why we aim to park in cash during bear markets
Why it pays to watch indexes more than economic data
Did you know that the market is six month forward-looking? This means that you are going to struggle gauging future market direction if you use the news headlines and economic indicators to guide you. Using the news headlines and economic data to guide your investment decisions doesn’t work because the market will have already factored all the news and data into its current price.
If you find the countless economic indicators confusing, join the club! How are you supposed to know if an industrial production figure is good or bad? How should you interpret the jobs report? We’ve found that economic gauges reflect the past or, at their best, the present. They won't really tell you the future. Often, by the time the economy starts cooling, stocks and investment funds will have already suffered a downturn.
Likewise, a new uptrend can emerge while economic activity is slumping, or even as the economic cycle is at its worst point. There are two headlines that we pay attention to. The first is ‘Federal Reserve Raises Rates’ and the second is, ‘Federal Reserve Lowers Rates’. The Federal Reserve is the US’s equivalent of the Bank of England and one of the Fed’s jobs is to decide if interest rates need to be changed. Interest rates are crucial to economic activity, and to the stock market. The stock market loves rate cuts and hates rate increases.
Did you know that the stock market has a personality?
The stock market can behave in different ways. Sometimes its personality is friendly and the market’s the best friend you could ever ask for. Other times however, the market’s like the bully from hell who beats you up and steals your lunch. Funds have a personality and so do stocks. In bull markets, they tend to act well. In bear markets, they turn tail and drop like stones from the sky.
The only way to know if the behaviour of the market, stocks or your fund is normal is by watching their activity extremely closely. For indexes and stocks, this means watching the action whilst the market is open and analysing the market once it’s closed. Funds don’t trade in real time and so their behaviour needs to be analysed after the market is closed. You have to put in the time to really get to know the personality and character of the market so that when something changes you’ll know and you’ll be able to react quickly.
Next week, in the next post in this series, we'll look at how the stock market works in cycles.
Remember, if you would like to know more, please just download our free report How to Gauge Stock Market Direction.
As always, if you have any questions or thoughts on the points covered in this post, please leave a comment below or connect with us @ISACO_ on Twitter.
About ISACO
ISACO specialises in ISA and SIPP Investment and is the pioneer of ‘Shadow Investment’; a unique service that allows you to look over our shoulder and buy the same funds that we are buying. Together with our clients, we have an estimated £57 million actively invested in ISAs and pensions*. Clients like us because we have a track record of ‘beating’ the FTSE 100**. Over the last 17 years, we’ve outperformed the Footsie by 77.9%. You can find us at www.ISACO.co.uk.
What is Shadow Investment?
Picking the right fund for your ISA and SIPP is not exactly the easiest job in the world. And knowing 'when' to buy and 'when' to exit is even more difficult! Our ‘Shadow Investment’ Service is here to help. Our service allows you to look over our shoulder and buy the same funds that we are buying.
When we are thinking of buying a fund, we alert you so that you have the opportunity to buy it on the same day that we buy it. We also tell you about when we are planning to exit the fund. You control your investment account, not us. You can start small and invest as little or as much money as you like.
By knowing what we are buying, when we are buying and when we are exiting, throughout the year you can mirror our movements and in effect replicate our trades. This means you have the opportunity to benefit from exactly the same investment returns that we get. Our investment aims are 10–12% per year.
We are totally independent, fully transparent and FCA compliant. We’re warm, friendly and highly responsive and it’s a very personal service that gives you direct access to the Sutherland brothers; ISACO’s two founders.
Who are ISACO’s clients?
Clients who benefit most from our service have over £250,000 actively invested and the majority of them are wealthy retirees, business owners, self-employed professionals and corporate executives. We also have clients from the financial services sector, such as IFAs and wealth managers.
Do you have questions?
To have all your questions answered, call 0800 170 7750 or email us at: info@ISACO.co.uk.
* November 15th 2012: Internal estimation of total ISA and pension assets owned by ISACO Investment Team and ISACO premium clients.
** December 31st 1997 - December 31st 2014 ISACO 105.5%, FTSE 100 27.6%. ISACO Investment performance verified by Independent Executives Ltd.
To download our free report 'A Golden Opportunity' >>
To download our Shadow Investment brochure >>
To start your 14 day free 'no obligation' trial of Shadow Investment >>


