The equity markets in April made fresh highs. Our portfolio also hit a new year to date high1 of 14.4% compared to our benchmark, the FTSE 100’s 8.0%.
This information is taken from The Big Picture, to download a sample copy please just click here.
111th April 2015. ISACO investment performance verified by Independent Executives Ltd.
Is the market healthy or unhealthy?
The way we use to check if the market is behaving as it should is to look at the trading action (price and volume activity) of institutional investors. Why do we do this? The stock market is about six month forward looking and its daily activity is the consensus conclusion whether institutional investors like or don’t like what they see happening down the road. By watching what the big players are doing (buying or selling) each and every day, it can provide essential clues to which way the market is likely to head.
It’s best to try to get ‘in sync’
Institutional investors control approximately 75% of the market’s future direction, which is why we aim to keep ‘in sync’ with them. If you don’t, it feels like trying to swim against a strong current. When you don’t get in sync, you often get hurt financially and that’s why we like to see if the 800-pound gorilla investors are buying, because when they do, it strengthens the market.
However, if they are selling, it weakens it. The other thing we like to keep a close eye on is the behaviour of leading stocks. If the markets best stocks are acting weaker than the general averages, it’s negative. However when leading stocks are outperforming the market, it’s positive.
Bull market? Bear market? Where are we?
Take a look at this 20-year chart of the NASDAQ Composite and you’ll see that the bull market that began in March 2009 (Point A) is six years old and for now remains intact.

Since the uptrend began, the NASDAQ Composite has made a very impressive return of 299.4%2. However, to make that gain it has had to experience three quite challenging corrections. The first (Point B) occurred from April to November 2010. The second (Point C) is a correction that started in May 2011 and ended in January 2012. The third (Point D), began in late March 2012 and finished March 2013. Since then we have had several retracement periods but none of them have been as severe as these three.
2Performance data taken 24th April 2015. ISACO investment performance verified by Independent Executives Ltd.
NASDAQ attempts to breakout
On Friday the 24th of April we pointed out in the Daily Market Update that the NASDAQ Composite gained 0.41% (Point E) in above average volume (Point F). Advances in greater than average trade indicate that institutional investors are buying stock – a bullish signal.

We also said…
“The good news is that yesterday’s 0.42% push higher means the Composite has finally beaten the ‘staying above 5000’ two day record. What’s more Thursday’s gain was made in heavy trade and the advance looks like it may have been the first day of a potential breakout move (Point G), which if true would be a huge plus.”
We then went on to say…
“With this in mind, we have moved our short-term outlook to neutral and wait to see if it has the staying power to remain above the all-important 5000 price level. If it can pull it off, it probably means that the NASDAQ has just begun another uptrend – after recently trading in an 8-week flat base (Point H).”
NASDAQ breakout fails
When we took a look at the NASDAQ Composite’s activity a week later (Friday the 1st of May 2015), the Composite had fallen hard over the last four days (Point I) and in heavy trade (Point J). What’s more, the first (Point K) of those four selling days was a textbook bearish reversal, made in very heavy trading volume which technically normally signifies a market top.

NASDAQ moves back above 50 day moving average
However, the index and stock action on Friday 1st May was positive. The NASDAQ gained 0.74% (Point L) in above average volume (Point M). Advances in greater than average trade indicate that institutional investors are buying stock – a bullish signal.
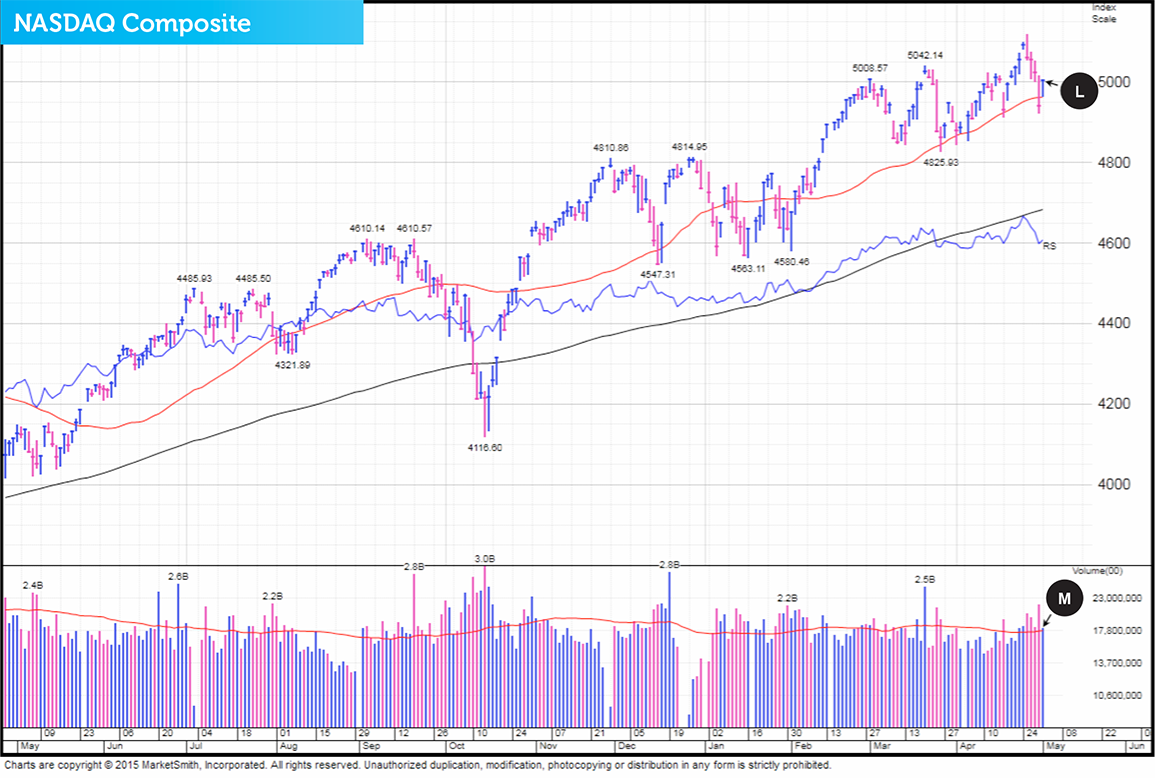
The good news is that Friday's move helped the NASDAQ get back above its 50-day moving average. What’s more, we have yet to see the market's leading stocks breaking down or at worst imploding. This is important to note because during bear market corrections – like the tech crash of 2000-2002 and the subprime crash of 2007-2009 – the markets best equities fell like stones.
And so for now we believe that the Composite may have just begun another healthy bull market correction. These types of corrections are less severe that their bear market counterparts. They tend to be not as deep and not last as long and therefore easier to stomach.
That would make a lot of sense because the summer doldrums are rapidly approaching. Normally during the summer months not much price progress is made by the equity indexes and often we see the market correct. Also during this period the majority of stocks and funds also tend not to perform at their best.
This information is taken from The Big Picture, to download a sample copy please just click here.
As always, if you have any questions or thoughts on the points covered in this post, please leave a comment below or connect with us @ISACO_ on Twitter.
As we grow our wealth, you grow yours. Together we prosper.
ISACO are a specialist in ISA and SIPP investment and together with our clients have an estimated £75 million actively invested3. To help investors like you, we offer a high end service called ‘Shadow Investment’. Put simply, we invest and you invest beside us. As we grow our wealth, you grow yours.
How does Shadow Investment work?
Shadow Investment allows you to look over our shoulder and buy the same investments that we are buying. It’s an intensely personal service which gives you the opportunity to piggyback on our expertise and makes investing easier, simpler and much more enjoyable.
Delivering superior performance
We have an active investment strategy which aims to control risk and deliver superior performance. Over the last 17 years4, we’ve beaten the FTSE 100 by 77.9% and over the last 3 years5, we’ve made an average annual return of 9.5% versus the FTSE 100’s 5.7%.
Get in touch
If you have over £250,000 actively invested, click here to arrange a free financial review (valued at £495) with Paul Sutherland, ISACO’s Managing Director.
3 Internal estimation taken January 1st 2015 of total ISA and pension assets owned by the ISACO Investment Team and ISACO premium clients.4 December 31st 1997 - December 31st 2014 ISACO 105.5%, FTSE 100 27.6%.
5 December 31st 2011 – December 31st 2014.
ISACO investment performance verified by Independent Executives Ltd.


