Each month we like to make sure that the funds we own are acting right. We have an active investment strategy which aims to control risk and deliver superior performance. We invest in a number of actively managed funds to form a complete investment portfolio and select what we believe to be the best funds in each asset class. We monitor all the investments selected, replacing under-performers and continuously rebalance the portfolios with the aim of maximising growth potential and managing risk.
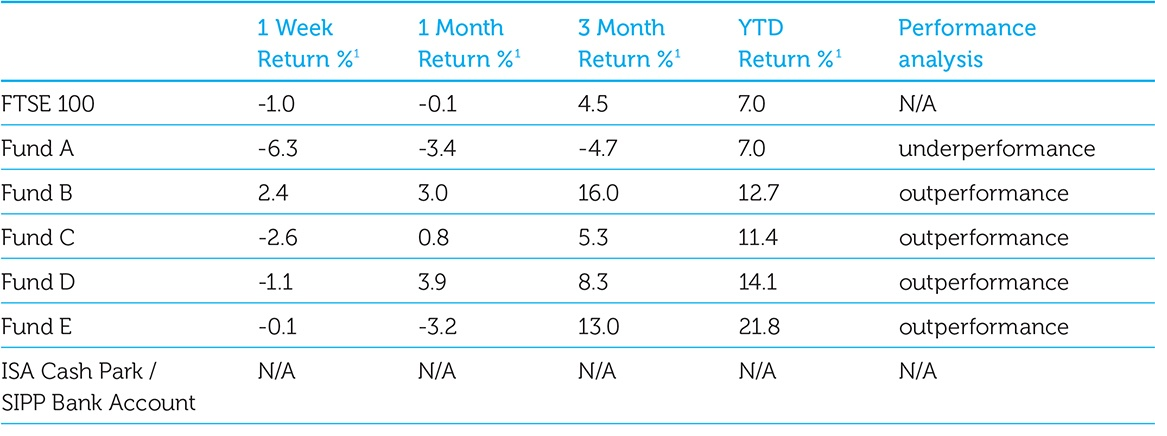
Typically we hold onto the funds that continue to outperform and exit or par down the ones that underperform. On April 23rd 2015, we looked at the returns of our five funds and compared them with the returns of the FTSE 100, our performance benchmark. This is what we discovered:
This information is taken from The Big Picture, to download a sample copy please just click here.
ISACO investment performance verified by Independent Executives Ltd.
Fund A - time to take some profits?
When this data was collected2, the laggard in our portfolio was Fund A. Fund A is currently the largest holding that we have and up until recently, it had been our top performing investment. However, as well as this month’s analysis displaying hard evidence of clear underperformance, there are also a number of other factors suggesting that it may be time to take some profits from it. These factors are:
- The fund is frequently acting ‘out of character and displaying abnormal weakness’,
- underperformance highlighted for the second time in the last three months,
- a recent abnormally high 6.3% drop over a five day period,
- the fund sometimes falling in value when the CLASSIFIED advances and
- the CLASSIFIED (which this fund is correlated to) is looking ‘technically’ bearish.
ISACO investment performance verified by Independent Executives Ltd.
Due to these latest findings we are going to take some profits off the table. The trade we plan to make is to switch 25% of the money currently invested in Fund A and invest the proceeds in CLASSIFIED.
Our outlook for 2015 and beyond
In April the market made fresh highs. Our portfolio also recently hit a new year to date high3 of 14.4% compared to the FTSE 100’s 8.0%. Currently4 we are sitting on a gain of 7.5% versus the FTSE 100’s 6.0%. After making 7.4% in 2014 compared to the FTSE 100’s -2.7% and a 23.1% return in 2013 versus the FTSE 100’s 14.4%, we are delighted that our investment decisions appear to be working out quite well. Making a fairly decent start to the year has caught us by surprise because only a few months ago we said…
’…we believe that we’ll experience flat or slightly negative returns for 2015.’
For now and to err on the side of caution, we are sticking with this forecast due to the robust gains we’ve made over the last two years. We are also adhering to it because we currently only have four months behind us and the summer doldrums are rapidly approaching. Normally during the summer months not much price progress is made by the equity indexes and often we see the market correct. Also during this period the majority of funds also tend not to perform at their best.
The important thing to remember is that right now we are still in a strong bull market. Our outlook for the longer term (5-10 years) is that we believe the markets will be much higher than they are right now.
From here we are therefore happy to sit out what we think will be much ‘milder’ correction periods than the ones investors experienced 2000-2002 and 2007-2009. This means that if you are a long-term investor like us, and have the courage to stay in the game, the future is looking bright.
3 13th April 2015.4 1st May 2015.
ISACO investment performance verified by Independent Executives Ltd.
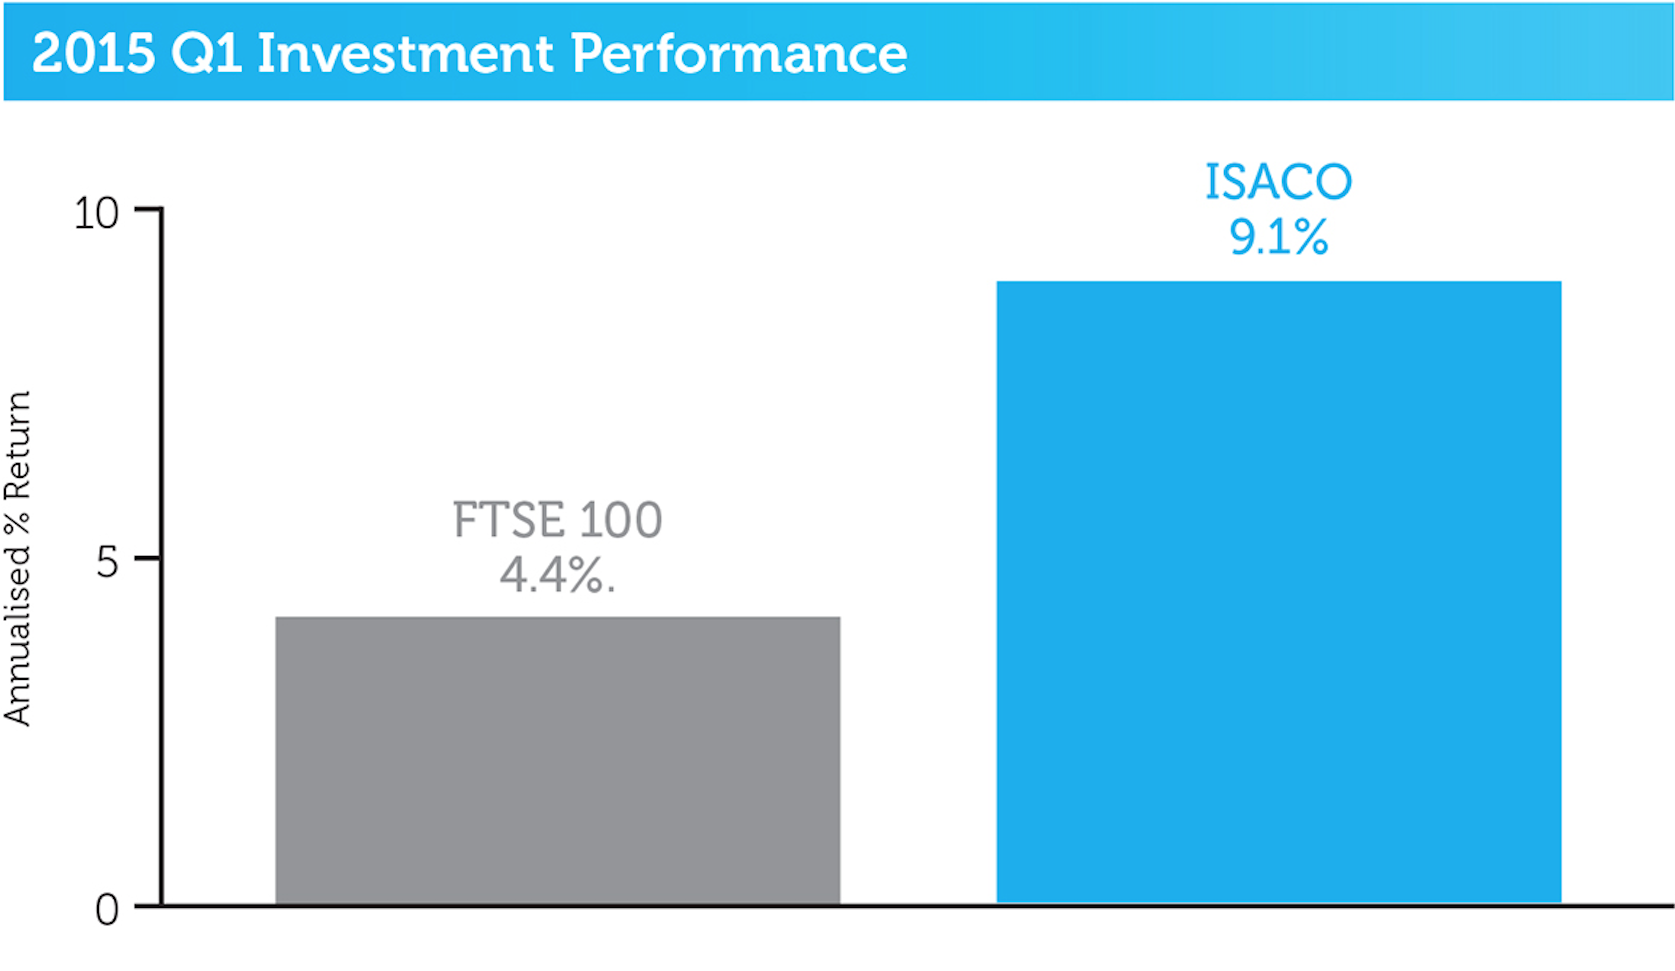
ISACO 2015 performance
Our aim is to outperform the FTSE 100 and we are very proud of our recent 2015 Quarter 1 return of 9.1%5 compared to the FTSE 100’s 4.4%5.
ISACO investment performance verified by Independent Executives Ltd.
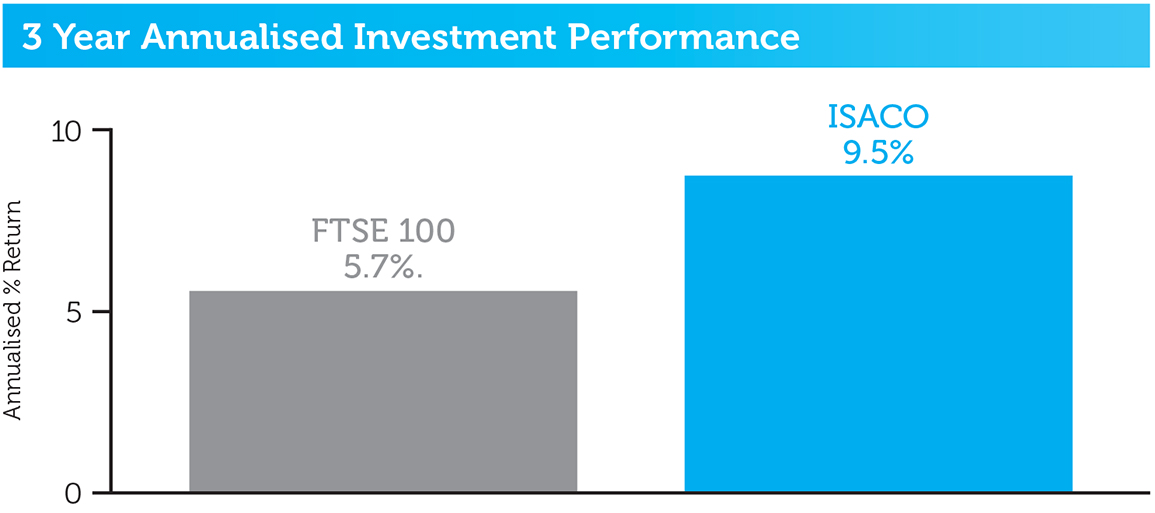
ISACO 3 year performance
We are also pleased with the returns that we’ve made over the last three years6 too. From the beginning of 2012 to the end of 2014, we have annualised 9.5% versus the FTSE 100’s 5.7%.
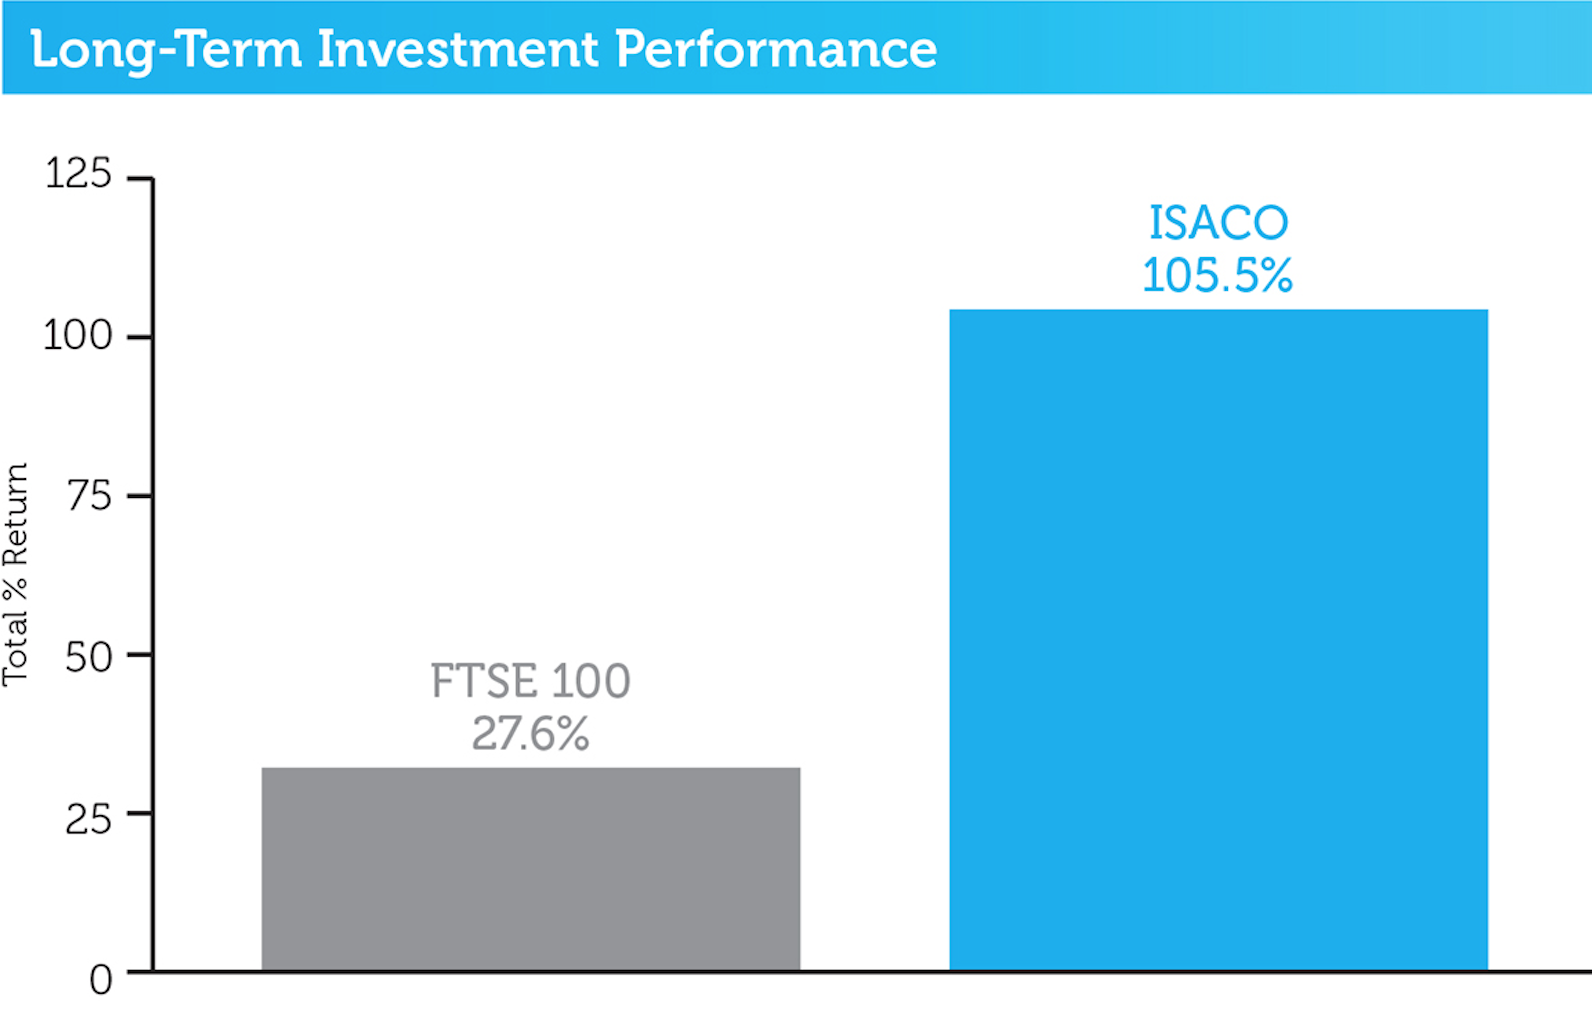
Long-term performance
The FTSE 100, our benchmark, has annualised 6.2% since its inception 31 years ago7. That tells us that if we can beat the FTSE 100 over the long term, we’re going to be blessed with a reasonable rate of return.
Since beginning investing back in 19978, we’ve outperformed the FTSE 100 by 77.9% which means we’ve beaten the main UK stock index on average by 2.9% per year. Remember however that past performance is no guarantee of future performance.
8 December 31st 1997 - December 31st 2014.
ISACO investment performance verified by Independent Executives Ltd.
This information is taken from The Big Picture, to download a sample copy please just click here.
As always, if you have any questions or thoughts on the points covered in this post, please leave a comment below or connect with us @ISACO_ on Twitter.
As we grow our wealth, you grow yours. Together we prosper.
ISACO are a specialist in ISA and SIPP investment and together with our clients have an estimated £75 million actively invested9. To help investors like you, we offer a high end service called ‘Shadow Investment’. Put simply, we invest and you invest beside us. As we grow our wealth, you grow yours.
How does Shadow Investment work?
Shadow Investment allows you to look over our shoulder and buy the same investments that we are buying. It’s an intensely personal service which gives you the opportunity to piggyback on our expertise and makes investing easier, simpler and much more enjoyable.
Delivering a superior performance
We have an active investment strategy which aims to control risk and deliver a superior performance. Over the last 17 years10, we’ve beaten the FTSE 100 by 77.9% and over the last 3 years11, we’ve made an average annual return of 9.5% versus the FTSE 100’s 5.7%.
Get in touch
If you have over £250,000 actively invested, click here to arrange a free financial review (valued at £495) with Paul Sutherland, ISACO’s Managing Director.
9 Internal estimation taken January 1st 2015 of total ISA and pension assets owned by the ISACO Investment Team and ISACO premium clients.10 December 31st 1997 - December 31st 2014 ISACO 105.5%, FTSE 100 27.6%.
11 December 31st 2011 – December 31st 2014.
ISACO investment performance verified by Independent Executives Ltd.


