August was a turbulent month for equity investors. However, we are proud that our investment portfolio continues to demonstrate outperformance – currently ahead of our benchmark by almost 6%1.
This information is taken from The Big Picture, to download a sample copy please just click here.
1Period measured, December 31st 2014 – August 29th 2015. ISACO 0.8%, FTSE 100 -4.8%.
ISACO investment performance verified by Independent Executives Ltd
Is the market healthy or unhealthy?
The way we use to check if the market is behaving as it should is to look at the trading action (price and volume activity) of institutional investors. Why do we do this? The stock market is about six month forward looking and its daily activity is the consensus conclusion whether institutional investors like or don’t like what they see happening down the road. By watching what the big players are doing (buying or selling) each and every day, it can provide essential clues to which way the market is likely to head.
It’s best to try to get ‘in sync’
Institutional investors control approximately 75% of the market’s future direction, which is why we aim to keep ‘in sync’ with them. If you don’t, it feels like trying to swim against a strong current. When you don’t get in sync, you often get hurt financially and that’s why we like to see if the 800-pound gorilla investors are buying, because when they do, it strengthens the market.
However, if they are selling, it weakens it. The other thing we like to keep a close eye on is the behaviour of leading stocks. If the markets best stocks are acting weaker than the general averages, it’s negative. However when leading stocks are outperforming the market, it’s positive.
Bull market? Bear market? Where are we?
Take a look at this 20-year chart of the NASDAQ Composite and you’ll see that the bull market that began in March 2009 (Point A) is almost six and a half years old.

Since the uptrend began, the NASDAQ Composite has made a very impressive return of 271%2. However, to make that gain it has had to experience four quite challenging corrections. The first (Point B) occurred from April to November 2010. The second (Point C) is a correction that started in May 2011 and ended in January 2012. The third (Point D), began in late March 2012 and finished March 2013. The final one is occurring right now and began July of this year (Point E).
2Performance data taken August 27th 2015.
ISACO investment performance verified by Independent Executives Ltd
NASDAQ sends out mixed signals
On Friday August 28th we wrote a very lengthy and detailed Daily Market Update.

In our update, we said…
‘The recent ‘heavy’ selloff that sparked a ‘change of personality’ in the indexes began Thursday August 20th (Point F) and continued over the next two days. From Wednesday’s August 19th close to Monday’s intraday low (Point G), the drop on the NASDAQ was 12%. Falling so much in such a short space of time is unusual and classed ‘abnormal’ behaviour. Since then the NASDAQ appears to have found support at the 4500 level, successfully testing it on three separate occasions (Point H).’
We continued with…
‘From Monday’s intraday low of 4292 to yesterdays close, the NASDAQ has subsequently rallied 12.1%. Gaining so much is such a short space of time is also unusual and classed abnormal activity, however we do often see large powerful snapbacks of this nature occur after a big market selloff. This huge rebound does not guarantee that we are now on the way back up, but it is a good start. Yesterday was the second ‘good’ index day we’ve seen since August 12th.’
We next mentioned that ideally we’d like to see the market follow through. Here’s what we said:
‘From here we ideally would like the market to follow through some day next week. A follow through is one of the indicators we use to help confirm a change of trend and also help verify the end of a correction period. For a successful follow through to occur, one of the main indexes ideally has to gain 1.7% or more in above average volume. Trade also needs to come in heavier than the previous day. We also like to see a follow through occur sometime between days four and seven of a new attempted rally. This rally started Wednesday (Point I) and so day four would be Monday and day seven would be next Thursday.’

We concluded the update with mentioning that we could be experiencing one of two scenarios. We said…
‘As we mentioned in the last three DMU’s, when looking at the big picture, our analysis still suggests that what’ is happening right now is either...
1) A very sharp violent shakeout.
2) The beginning of a bear market.
Scenario 1: A very sharp violent shakeout.
After the last two days behaviour, the likelihood that this scenario is correct has increased. If this scenario is true, it would mean the retracement we are in right now is a nothing more than another healthy bull market correction. It would also mean that the ultimate bottom to this correction occurred Monday August 24th when the NASDAQ hit a low of 4292. The clues that tell us that this first scenario is correct are things such as seeing the smart money immediately buying into Monday’s weakness and the 12.1% surge that we’ve seen from Monday’s low of 4292. This first scenario also ties in with the argument that recently we’ve seen a lot of ‘panic irrational’ selling rather than ‘informed intelligent’ selling. There are also other things that strengthen this argument such as extreme bearishness from the media right now (this happens at market bottoms). Another thing that caught our attention that also feeds this first argument is the recent action on the VIX, an index that measures volatility and often spikes up when markets are at or close to a bottom. On Monday it jumped to levels not seen since the nadir of the 20% 2011 NASDAQ correction.
Scenario 2 - The beginning of a bear market.
After the last two days behaviour, the likelihood that this scenario is correct has decreased. However if scenario 2 is correct, it means that right now we are possibly at the beginning of a new bear market. This would mean that over the course of time, the markets and funds would go much lower, possibly for the next 12-18 months. The clues that suggest we are in a scenario 2 situation are as follows. The first is the ‘change of personality’ we noticed on the main indexes August 20th. We also saw that shift in character continue this week and noticed that the markets leading stocks were also badly affected on Monday. Further clues that we have entered a new bear market are coming from the recent massive drops we’ve seen in the funds we own.’
Watching for more clues of the market's true intentions
When we looked at Friday Sepetmber 4th's action the index and stock action was positive. The NASDAQ Composite fell 1.05% (Point M). The drop was fairly significant however trading volume was far below average (Point N). This is textbook ideal because declines in less than average trade suggest that institutional investors are reluctant to sell stock. This was the second day in a row that we’ve seen this happen which is an encouraging sign.
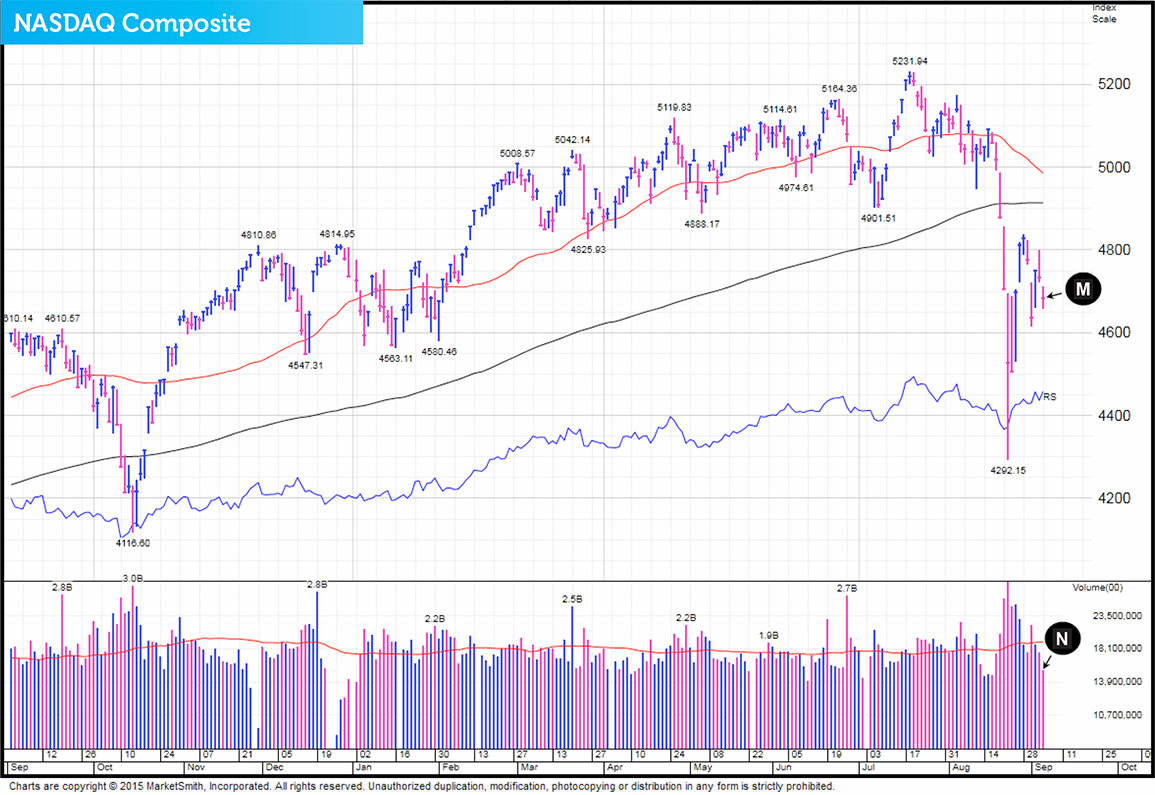
Leading stocks action was positive. Even though the market fell, an equal number of the market's best stocks gained on heavy trade as ones that fell on heavy trade, which on a market down day is seen as a bullish divergence. This was the second consecutive ‘bullish divergence’ day for leading stocks behaviour – another plus.
When looking at the charts of the market's leading stocks, surprisingly the majority of them are looking in pretty good shape. Almost all of them are experiencing corrections which we’d expect to see when the major indexes are pulling back. However there are hardly any that are looking as technically damaged as indexes such as the NASDAQ Composite. This is a good sign and feeds the argument that this correction is healthy and has most probably already made its low. This is when the Composite came down Monday August 24th and touched 4292 (Point O). The NASDAQ also appears to have a decent wall of support between 4500 and 4600 (Point P).
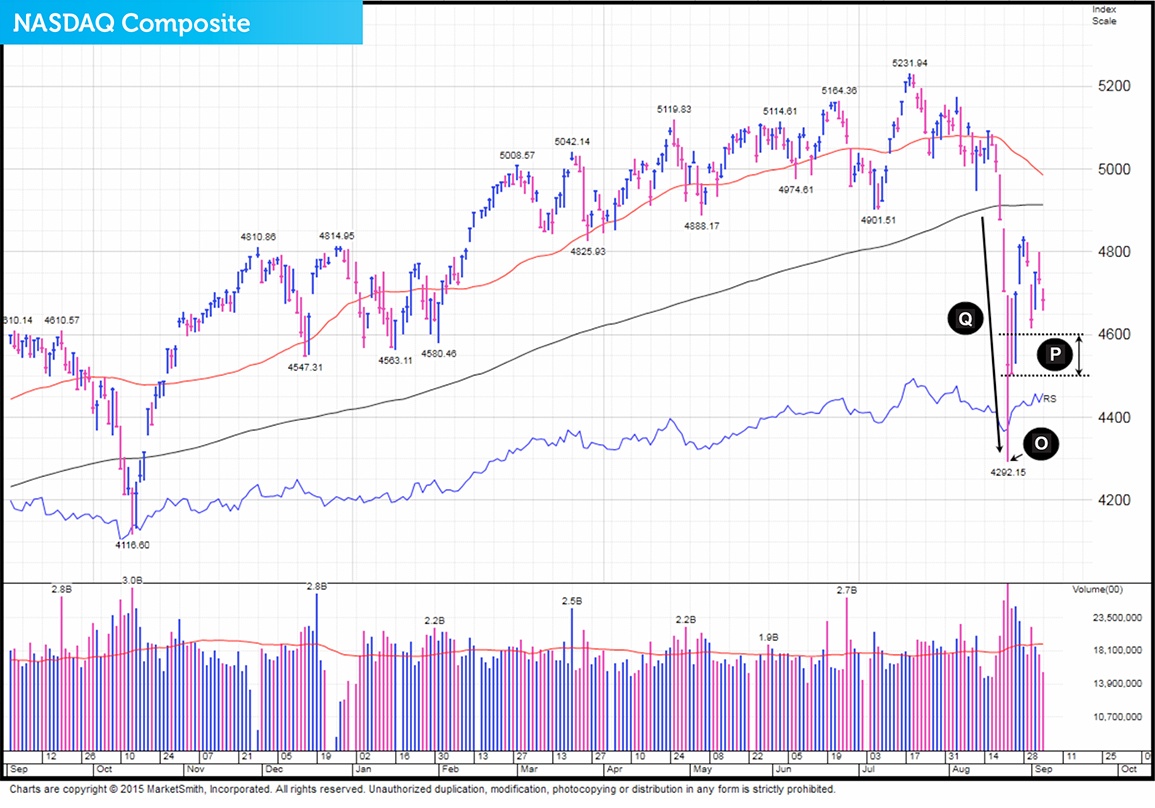
However even though things have quietened down a little and the environment is currently looking and feeling slightly better, we have to be fully aware of the recent ‘change in personality’ of the market. This occurred from the 20th to the 24th of August (point Q) when we saw the NASDAQ plunge a jaw dropping 14.5% (measured from the close of August 19th to the intraday low of August 24th). This means that until we get further signals to say ‘all is well’ we still cannot rule out the possibility that we have just entered a new bear market.
For now, we remain neutral with our short-term stance and are pleased with our recent decision to CLASSIFIED. As always we will play things one day at a time and if we feel the need to CLASSIFIED we will do so. For now, we watch and wait and continue to look for more clues of the markets true intentions.
This information is taken from The Big Picture, to download a sample copy please just click here.
As always, if you have any questions or thoughts on the points covered in this post, please leave a comment below or connect with us @ISACO_ on Twitter.
As we grow our wealth, you grow yours. Together we prosper.
ISACO are a specialist in ISA and SIPP investment and together with our clients have an estimated £75 million actively invested3. To help investors like you, we offer a high end service called ‘Shadow Investment’. Put simply, we invest and you invest beside us. As we grow our wealth, you grow yours.
How does Shadow Investment work?
Shadow Investment allows you to look over our shoulder and buy the same investments that we are buying. It’s an intensely personal service which gives you the opportunity to piggyback on our expertise and makes investing easier, simpler and much more enjoyable.
Delivering superior performance
We have an active investment strategy which aims to control risk and deliver superior performance. Over the last 17 years4, we’ve beaten the FTSE 100 by 77.9% and over the last 3 years5, we’ve made an average annual return of 9.5% versus the FTSE 100’s 5.7%.
Get in touch
If you have over £250,000 actively invested, click here to arrange a free financial review (valued at £495) with Paul Sutherland, ISACO’s Managing Director.
3 Internal estimation taken January 1st 2015 of total ISA and pension assets owned by the ISACO Investment Team and ISACO premium clients.4 December 31st 1997 - December 31st 2014 ISACO 105.5%, FTSE 100 27.6%.
5 December 31st 2011 – December 31st 2014.
ISACO investment performance verified by Independent Executives Ltd.


