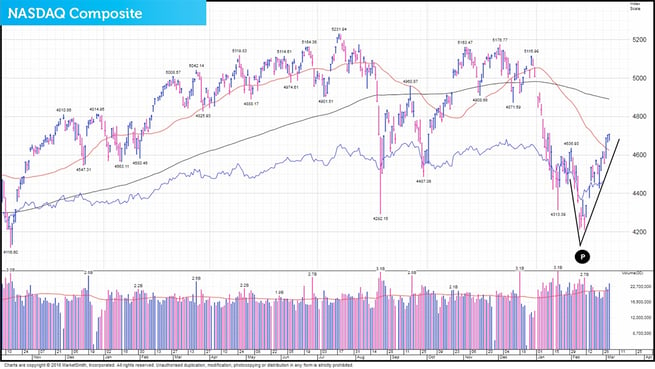
The market's recent behaviour is bullish and the rebound so far has been powerful. For example, we’ve made a robust 11.3% return over the last three weeks1.
This information is taken from The Big Picture, to download a sample copy please just click here.
Is the market healthy or unhealthy?
The way we use to check if the market is behaving as it should is to look at the trading action (price and volume activity) of institutional investors. Why do we do this? The stock market is about six month forward looking and its daily activity is the consensus conclusion whether institutional investors like or don’t like what they see happening down the road. By watching what the big players are doing (buying or selling) each and every day, it can provide essential clues to which way the market is likely to head.
1 February 13th-March 3rd 2016.
It’s best to try to get ‘in sync’
Institutional investors control approximately 75% of the market’s future direction, which is why we aim to keep ‘in sync’ with them. If you don’t, it feels like trying to swim against a strong current. When you don’t get in sync, you often get hurt financially and that’s why we like to see if the 800-pound gorilla investors are buying, because when they do, it strengthens the market.
However, if they are selling, it weakens it. The other thing we like to keep a close eye on is the behaviour of leading stocks. If the markets best stocks are acting weaker than the general averages, it’s negative. However when leading stocks are outperforming the market, it’s positive.
Bull market? Bear market? Where are we?
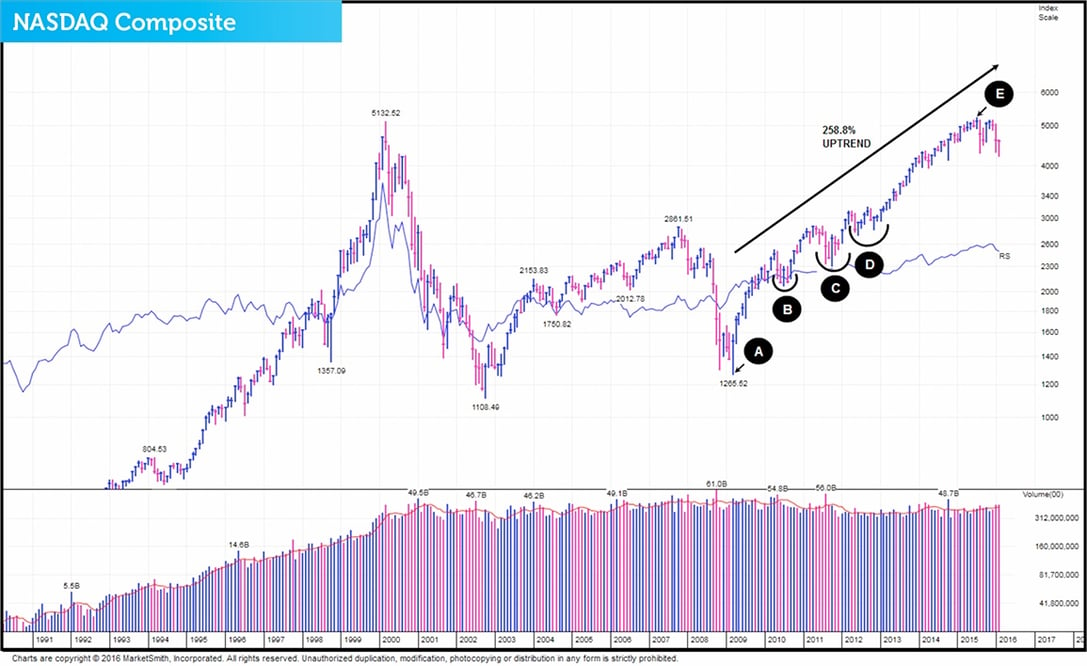
Take a look at this 20-year chart of the NASDAQ Composite and you’ll see that the bull market that began in March 2009 (Point A) is still in play.
Since the uptrend began, the NASDAQ Composite has made a very impressive return of 258.8%2. However, to make that gain it has had to experience four quite challenging corrections. The first (Point B) occurred from April to November 2010. The second (Point C) is a correction that started in May 2011 and ended in January 2012. This second one was quite harsh and resembled a ‘mild’ bear market’. The third (Point D), began in late March 2012 and finished March 2013. The final one is occurring right now and resembles the 2011 retracement and has the hallmarks of a ‘mild bear market. This one began last July (Point E). The good news for equity investors is that this present one looks like it’s just found a bottom which would mean that it’s now on its way back up.
2 Performance data taken February 25th 2016.
Latest ‘follow through’ looks more convincing
In our Daily Market Update on Thursday February 25th, we pointed out quite a few key points such as…
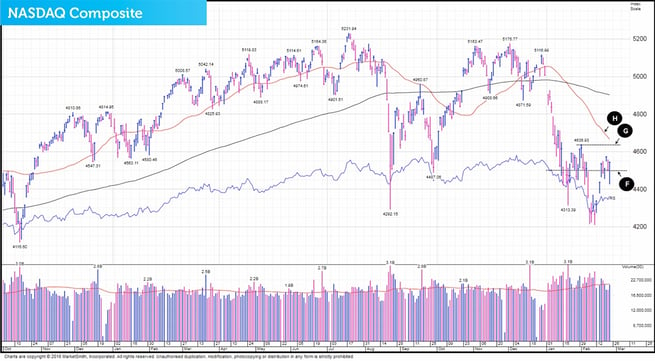
‘We also like how the Composite has behaved over the last five days as it appears to be demonstrating that it has some good support at the 4500 level (Point F). In the short term, its next two hurdles to scale – where it will probably come across some selling resistance – are the 4637 level (Point G) and also its 50-day moving average (Point H).’
We also made the following observation…
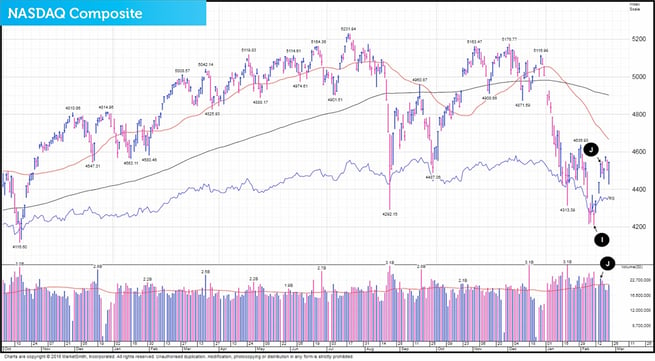
‘The main thing to report is that ‘all is good’ with the market's overall behaviour. And if we recap recent key events, the NASDAQ found a bottom February 11th (Point I) and then successfully ‘followed through’ three days later (Point J).’
Other salient points were also mentioned such as…
‘The other good thing with this latest rally attempt is that our portfolio is without a doubt in sync with the market. Also it’s been demonstrating strong outperformance suggesting that the market's previous leadership, such as biotech and Japan have not fallen out of favour. Also the snapback has so far been extremely powerful, for instance we saw an 8.7% return over the six trading days between February 13th and February 23rd. We are also still of the opinion that Japanese equities and the biotech sector simply needed to experience extremely severe and deep corrections – probably because of their previous enormous run ups. But of course this latest rally is still in the very early stages, which means it may be weeks or even months before we really know who the true leaders are.’
We closed our daily update with the following comments:
‘We also remain happy sitting tight for now in our chosen funds and in summary, it looks like all the investors who needed to sell have finally sold and if this proves to be true, we are now back on the up.’
Highly likely rally will succeed
When looking at the markets on Friday March 4th, in our Daily Market Update we said…
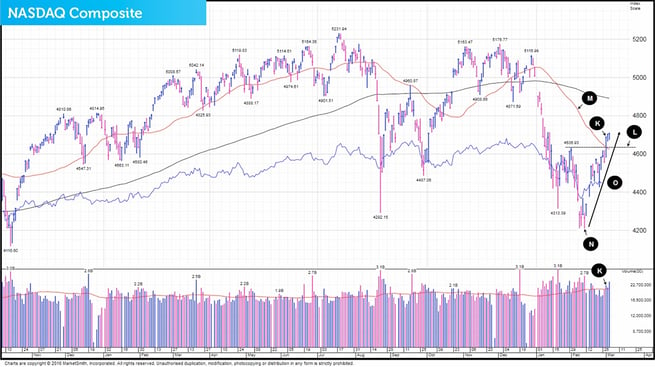
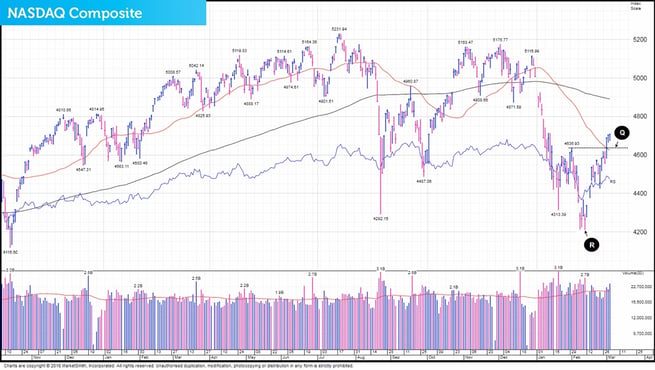
‘Three days ago we saw the NASDAQ surge 2.89% in heavy trade (Point K). This bullish behaviour helped it to break back above its previous resistance level of 4637 (Point L) and its all-important 50-day moving average (Point M).’
We continued with…
‘What’s more, since it found a floor on February 11th 2016 (Point N), the Composite has vaulted 10.3% in just fourteen trading sessions (Point O). This ‘abnormally’ strong move in such a short space of time has now caused the recovery since the bottom to be a little ‘V’ shaped (Point P). When we spot such a pattern, it tells us that at any time that it could retrace sharply.’
In the update, we also pointed out another key observation. We said…
‘The NASDAQ clearly has momentum which means that even though its formed a ‘V’ shaped pattern, it’s still more likely to keep heading higher. However eventually this upwards momentum is going to wane and when it does run out of puff, from a technical perspective we’d want to see the previous resistance level of 4637 become an area of strong support (Point Q).
So far we really like this latest recovery off the recent lows which right now is just three weeks old. It appears highly likely that this rally attempt is going to be successful and if this was true, the 4209 low the Composite made February 11th 2016 (Point R) will eventually turn out to be the absolute bottom of this current correction.’
This information is taken from The Big Picture, to download a sample copy please just click here.
As always, if you have any questions or thoughts on the points covered in this post, please leave a comment below or connect with us @ISACO_ on Twitter.
As we grow our wealth, you grow yours. Together we prosper.
ISACO are a specialist in ISA and SIPP investment and together with our clients have an estimated £75 million actively invested3. To help investors like you, we offer a high end service called ‘Shadow Investment’. Put simply, we invest and you invest beside us. As we grow our wealth, you grow yours.
How does Shadow Investment work?
Shadow Investment allows you to look over our shoulder and buy the same investments that we are buying. It’s an intensely personal service which gives you the opportunity to piggyback on our expertise and makes investing easier, simpler and much more enjoyable.
Delivering superior performance
We have an active investment strategy which aims to control risk and deliver superior performance. Over the last 18 years4, we’ve beaten the FTSE 100 by 99.7% and over the last 3 years5, we’ve made an average annual return of 9.8% versus the FTSE 100’s 1.9%.
Get in touch
If you have over £250,000 actively invested, click here to arrange a free financial review (valued at £495) with Paul Sutherland, ISACO’s Managing Director.
3 Internal estimation taken January 1st 2015 of total ISA and pension assets owned by the ISACO Investment Team and ISACO premium clients.
4 December 31st 1997 - December 31st 2015 ISACO 121.0%, FTSE 100 21.3%.
5 December 31st 2012 – December 31st 2015.
To download our free report 'A Golden Opportunity' >>
To download our Shadow Investment brochure >>

