
In our last few posts we've been looking at how you can gauge the stock market's direction. In this post, we'll conclude this series by looking at how you can spot if the market's about to turn.
In our last few posts we've been looking at how you can gauge the stock market's direction. In this post, we'll conclude this series by looking at how you can spot if the market's about to turn.

Throughout the year, come rain or shine, we love to watch the daily activity of the market’s best stocks. The reason we watch them like a hawk is because they tend to lead the market higher – and lead the market lower – before the general market catches on. This means that they are a very good indicator of which direction the market is likely to head next.

In a recent post, we looked at how it's possible to read the market by using charts.
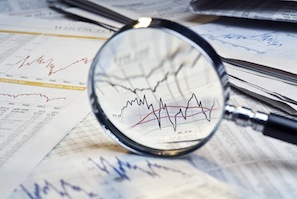
To recap, a stock chart is a graph that displays the price and volume history of a given security or index over a period of days, months or years. Price and volume charts can help you to see what the professional investors are doing, allowing you the opportunity to follow in the large investors footsteps.
If you would like to know more, why not download our latest free report Gauging Stock Market Direction.
As you probably know, here at ISACO we regularly produce free investment reports and guides. As a reader of our blog, we'd like to give you the opportunity to be one of the first to download our latest free report Gauging Stock Market Direction.

In our last post, we explained how we have outperformed the market over the last 12 months (June 1st 2012 – June 1st 2013) with a return of 29.9%. In this post we'll give you an overview of how we did it.
Tags: Investment funds, Investment strategy, Investment news

We don’t always outperform the market but we are proud that over the last 12 months* we have beaten both the Nasdaq Composite and the FTSE 100.

One of the best ways of reading the market's health is to look at charts. A stock chart is a graph that displays the price and volume history of a given security or index over a period of days, months or years. Price and volume charts help you to see what the professional investors are doing, allowing you the opportunity to follow in the large investors footsteps.

In our last post we looked at reading the market and the importance of timing your investments. In the post, we'll go on to examine how the market works in cycles and how you can evaluate its health.

In our last post we looked at the problems associated with a 'buy and hold' investment strategy. We concluded that a buy and hold approach could only work if you made your investment at the right time, but unfortunately most investors don’t buy at the optimum point. In this post we'll look at reading the market and timing your investments.

It's easy for some investors to believe that the best approach is a passive buy and hold investment strategy. The mantra goes ‘it’s time in the market, not market timing'. While buy and hold can be an effective strategy, if the investor starts at the right time and buys when the market is low, it is an approach that comes with flaws.


